
Figure 2. Heat map of the Spearman correlation (r) between blood biomarkers.
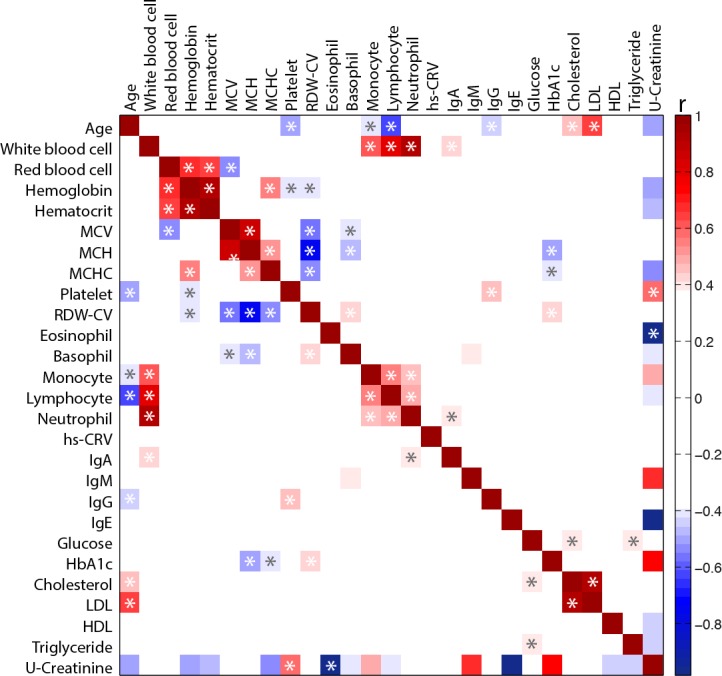
Correlations were performed between each blood biomarker for the overall population. Key: MCV, mean corpuscular volume; MCH, mean corpuscular hemoglobin; MCHC, mean corpuscular hemoglobin concentration; RDW-CV, red cell distribution width; Hs-CRV, high sensitivity C-reactive protein; HbA1C, glycated hemoglobin; LDL, low density lipoprotein; HDL, high density lipoprotein. *Significant correlation (p < 0.05) after correction using Benjamini and Hochberg false discovery rate method with a false discovery rate Q = 0.20.