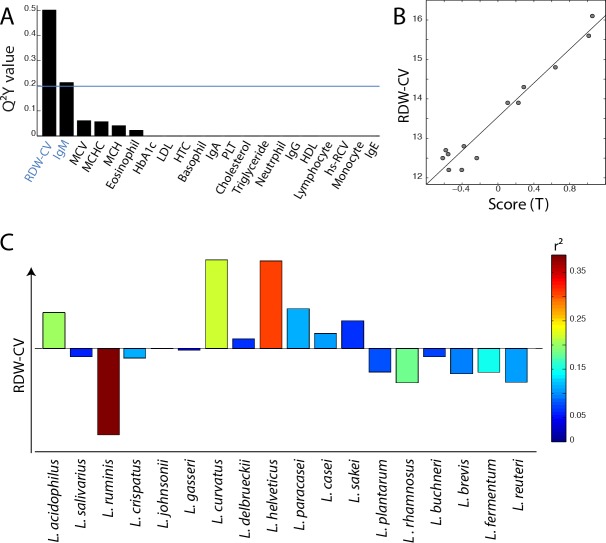
Figure 4. Association of Lactobacillus species profile with blood biomarkers in adult individuals.
A. Histogram of descending Q2 values calculated from O-PLS model performed using the profile of Lactobacillus species as X matrix and the quantitative levels of 21 blood biomarkers as independent response predictors for the adult population only. B. Scores derived from the O-PLS model using RDW levels as a response predictor (this model uses one orthogonal component; R2Y = 0.95, R2X = 0.28, Q2Y = 0.67, p-value = 0.005 and p-value FDR = 0.013). C. Loadings plot derived from the same model as in B., Lactobacillus species pointing upward on the loadings plot are positively correlated with RDW levels.

