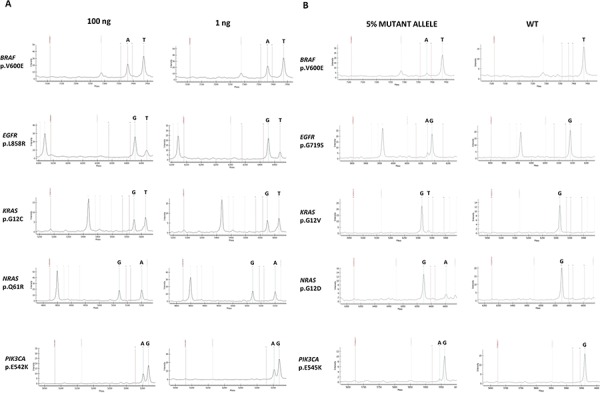
Figure 3. PentaPanel performance.

A. Representative spectra of samples with high (100 ng) or low (1ng) DNA template input showing similar frequency of the detected mutations; B. Representative spectra of the sensitivity study showing positive calls for mutations at 5% dilutions.
