
Figure 8. A. Expression levels of p-AKT, AKT, p-4E-BP1, AMPK and p-AMPK in CaSki and SiHa cells.
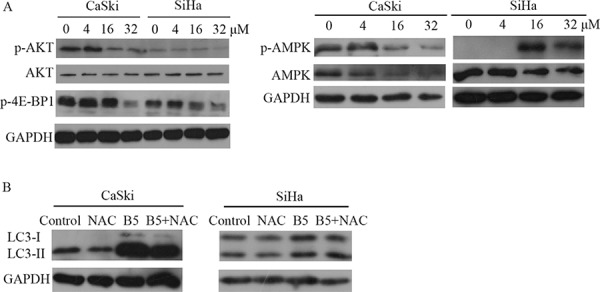
Cells were treated with 0, 4, 16, and 32 μM B5 for 48 h and subjected to western blotting analysis. GAPDH was used as the internal control. B. Effect of ROS on B5-inducd autophagy. CaSki and SiHa cells were treated with ROS inhibitor NAC prior to 16 μM B5 treatment for 48 h. Expression levels of LC3-II were determined by western blotting analysis. All data are representatives of three independent experiments.