
Figure 9. Effects of the autophagy inhibitors, 3-MA and CQ, on B5-induced cell growth inhibition and apoptosis.
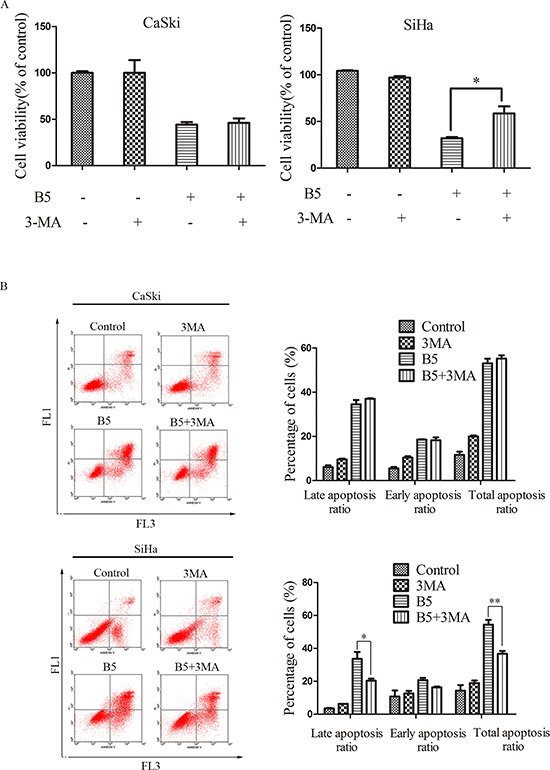
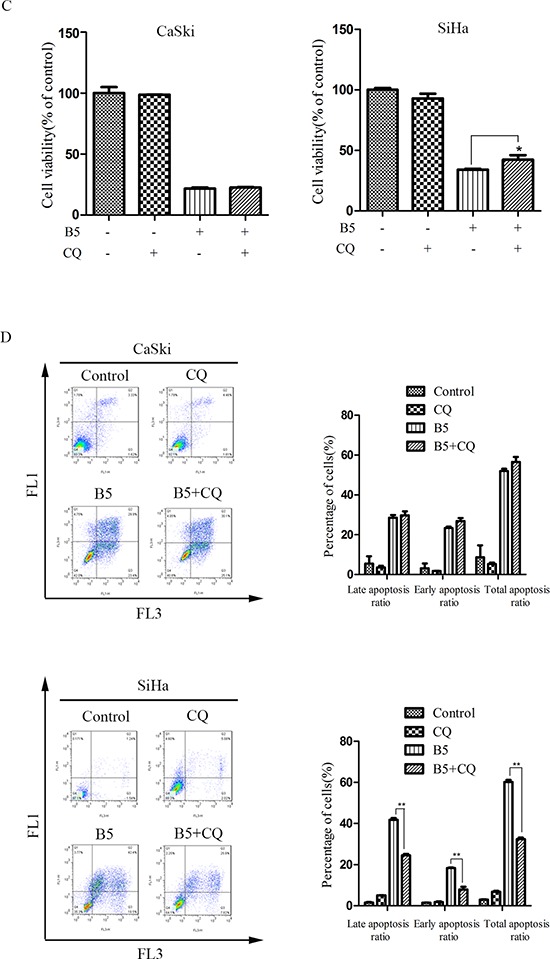
The cells were pretreated with 5 mM 3-MA A. and B. C. and D. For 1 h and then treated with 16 μM B5 for 48 h. Cell viability was determined by the MTT assay (A and C). Apoptotic cells were quantified by Annexin V-FITC/PI staining analysis (B and D). Data are presented as the mean ± SD of three independent experiments. *P < 0.5 and **P < 0.01.