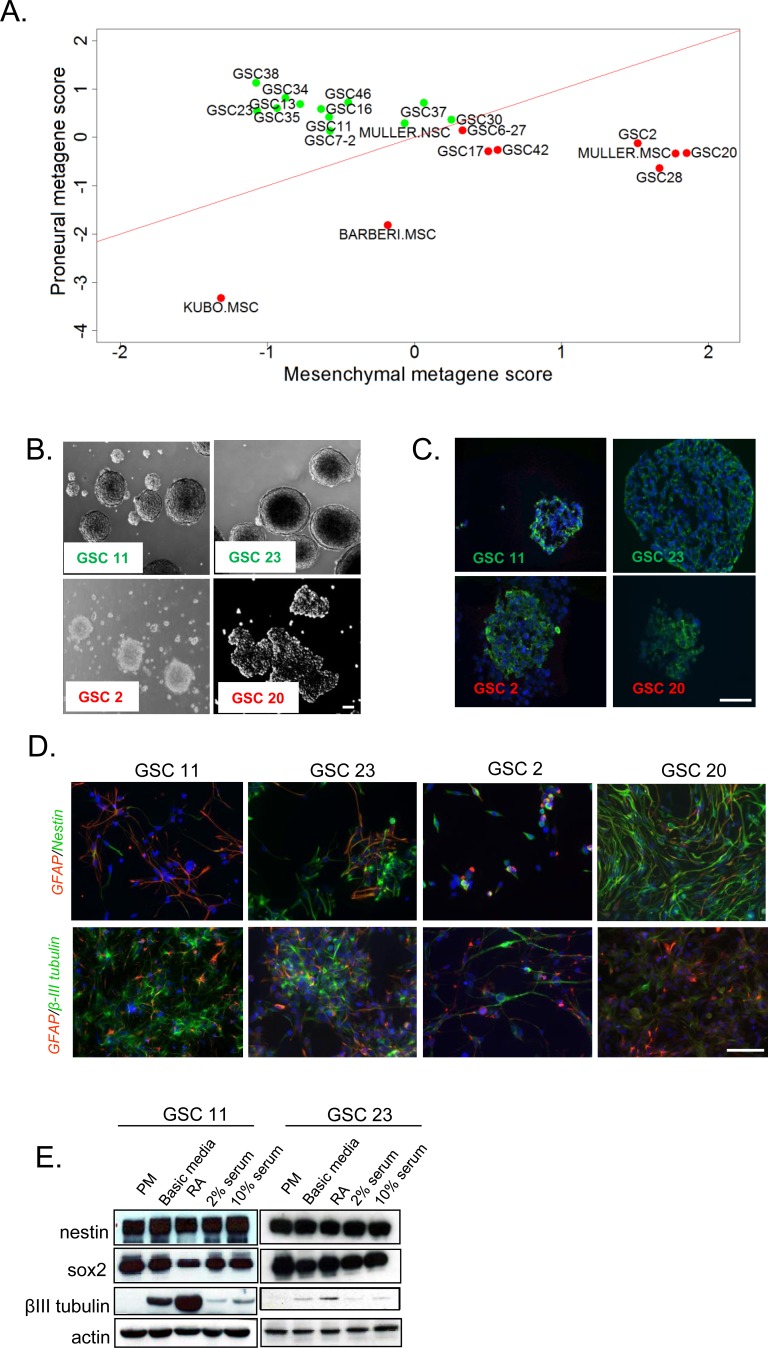
Figure 1. In vitro evaluation of stem cell like-characteristics of human GSCs.
A. Metagene plots of PN (green) versus MES (red) GSCs in comparison to human normal NSCs and MSCs. B. Bright field microscopic images of neurospheres of GSCs 11, 23, 2, and 20. Scale bar = 50μm. C. Undifferentiated GSC neurospheres stained for NSC marker nestin. Scale bar = 50μm. D. Immunofluorescent analyses of GSCs cultured in media containing retinoic acid or serum. Upper panel shows co-staining for astrocyte marker GFAP (red) and NSC marker nestin (green). Lower panel shows staining for neuronal specific β-III tubulin (green) and astrocytic marker GFAP (red). Scale bar = 100μm. E. Western blot analysis of neural stem cell and lineage markers in PN GSCs cultured in PM, basic media that lacks growth factors, RA, 2% serumor 10% serum. β-actin was used as a loading control.

