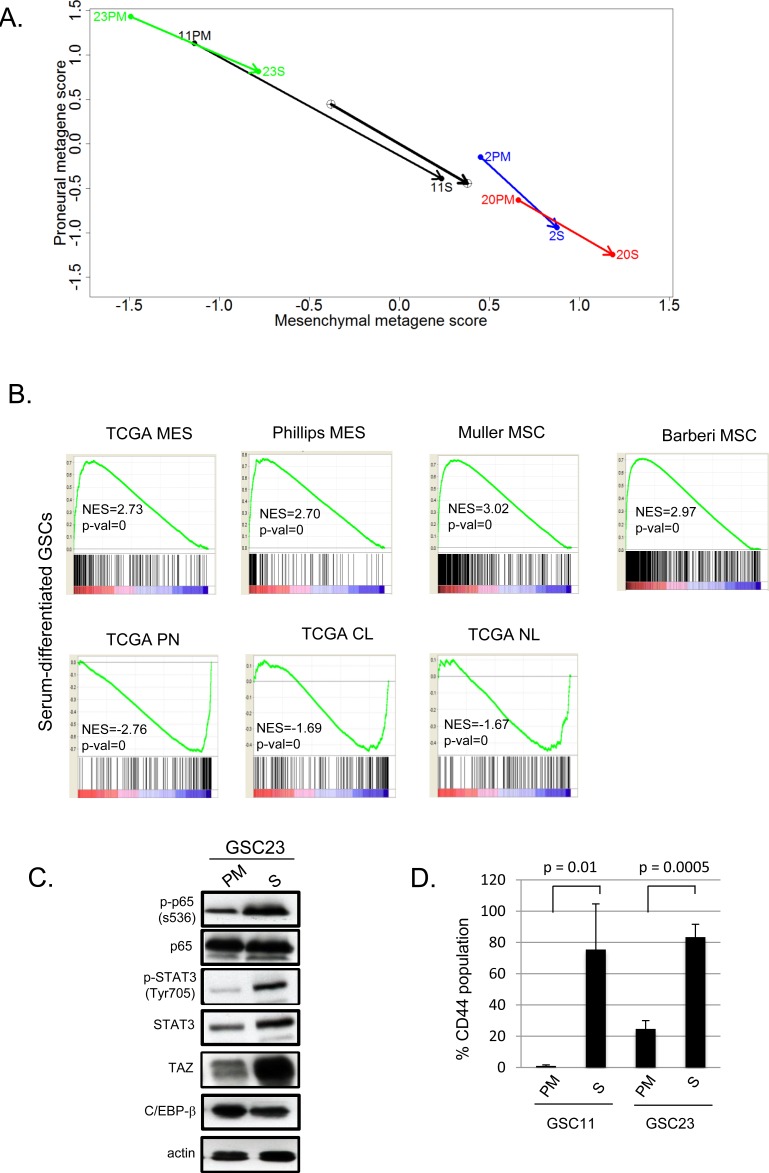
Figure 3.
A. Metagene plots of GSCs cultured in PM or 10% FBS for 60 days (S). B. GSEA analysis of genes induced after differentiation in 10% FBS for 60 days versus queried gene lists. The normalized enrichment scores (NES) and p values are shown below each plot. C. Western blotting of GSC23 cultured in PM or S. D. Bar graphs showing percent CD44 expression in GSCs cultured in PM or S as determined by flow cytometry. Error bars indicate standard deviation of three independent experiments. A two tailed t-test was performed to test for statistical significance.

