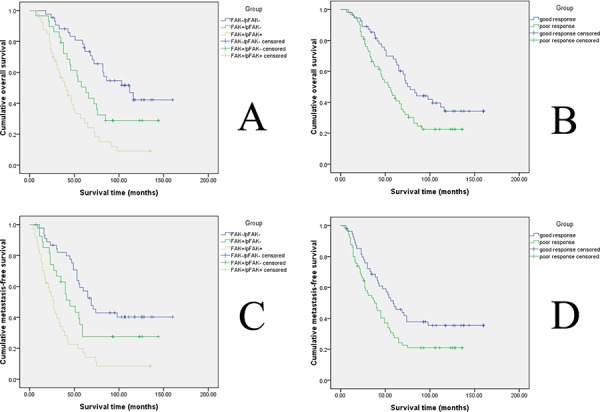
Figure 2. Kaplan–Meier analysis of overall survival and metastasis-free survival for patients with different FAK expression levels and for patients with different histological responses to pre-operative chemotherapy.

A. Kaplan–Meier analysis of overall survival in osteosarcoma. The blue line represents the FAK-/pFAK- group, the green line represents the FAK+/pFAK- group, and the brown line represents the FAK+/pFAK+ group. B. Kaplan–Meier analysis of metastasis-free survival in osteosarcoma. The blue line represents the FAK-/pFAK- group, the green line represents the FAK+/pFAK- group, and the brown line represents the FAK+/pFAK+ group. C. Kaplan–Meier analysis of overall survival in osteosarcoma. The green line represents patients with a good histological response to pre-operative chemotherapy and the blue line represents patients with a poor histological response to pre-operative chemotherapy. D. Kaplan–Meier analysis of metastasis-free survival in osteosarcoma. The green line represents patients with a good histological response to pre-operative chemotherapy and the blue line represents patients with a poor histological response to pre-operative chemotherapy.
