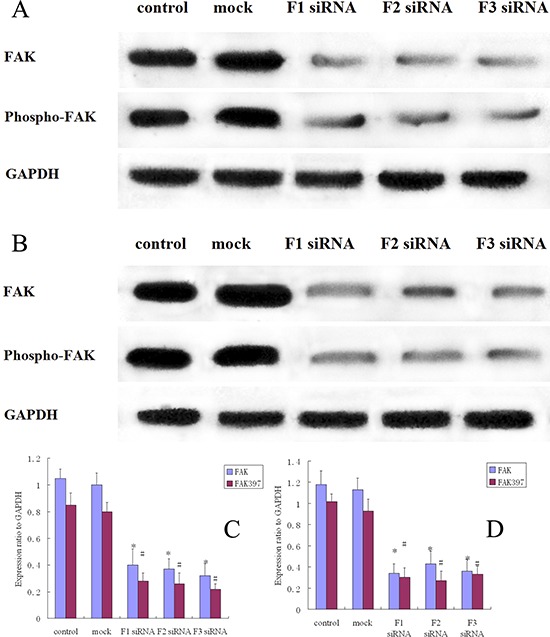
Figure 3. FAK protein expression and FAK phosphorylation in siRNA treated osteosarcoma, control and mock group cells.

A. Western blot analysis of FAK and pFAK in MG-63 cells from control, mock, F1 siRNA, F2 siRNA and F3 siRNA groups. GAPDH was used as a control for protein load and integrity. B. Western blot analysis of FAK and pFAK in 143B cells from control, mock, F1 siRNA, F2 siRNA and F3 siRNA groups. GAPDH was used as a control for protein load and integrity. C. The bar chart demonstrates the ratio of FAK and pFAK protein to GAPDH by densitometry in MG-63 cells. The data are means ± SEM. D. The bar chart demonstrates the ratio of FAK and pFAK protein to GAPDH by densitometry in 143B cells. The data are means ± SEM.
