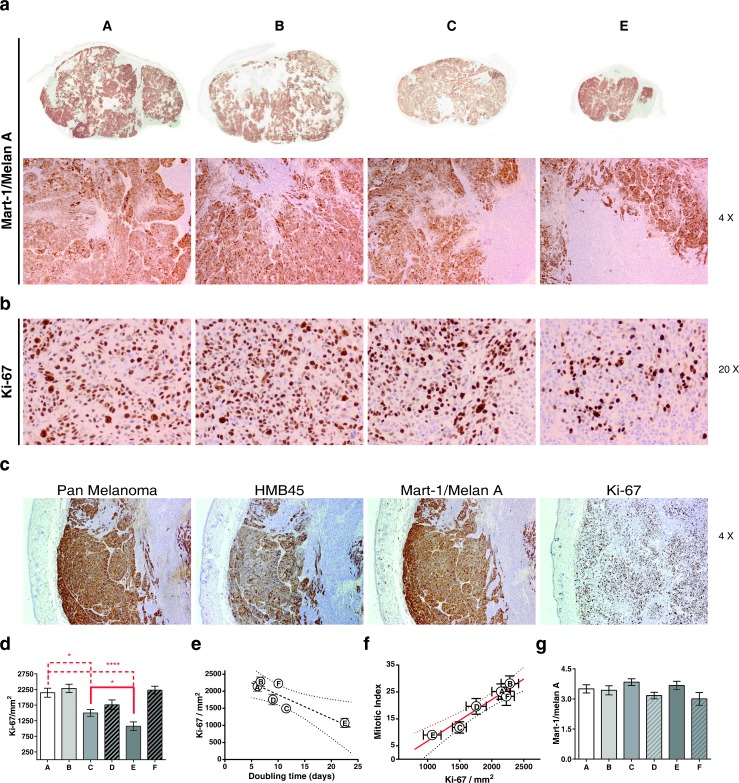
Figure 10.
A: Control; B: MSC: C: RT(2Gy) and E: RT(2Gy)+MSC. a. Photomicrographs of Mart-1/melan A, immunohistochemical expression of the melanoma G361 cell line xenograft on mice. First row, panoramic view. Second row, note the two types of cell populations, negative and positive, for Mart-1/MelanA in all groups. b. Photomicrographs of Ki-67 immunohistochemical expression at the end of the trial in G361 xenotumors treated indifferent ways. The nuclear Ki-67 expression was lesser in RT and in RT(2Gy)+MSC groups. c. Similar immunohistochemical expression of three melanoma markers in G361 cell line xenograft on mice from control group. Note two types of cell populations for several markers of differentiation (micropolymer peroxidase-conjugated, original magnification x20). d. Therelationship between the values of MI measured with hematoxiline-eoxine and with Ki-67 staining. e. Experimental points fitted to a straight line (R2 = 0.939). f. Relationship between the MI and Ki-67 (P = 0.0014). g. We have no found association between the expression of Mart-1/Melan A assessed by score and the tumor size.

