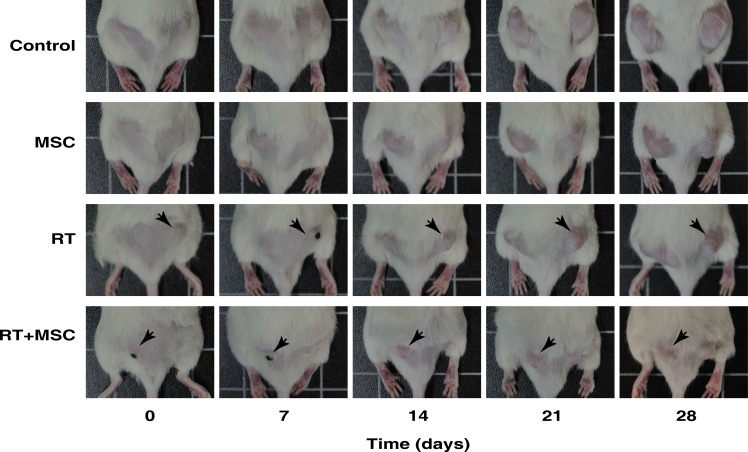
Figure 7. Representative images of mice inoculated with 1·106 G361 human melanoma cell line. Mice with a tumor size of approximately 65 mm3 were treated in different ways as indicated for 4 weeks after the start of the treatment.
Images of tumour growth were made at the beginning of the experiment (day 0) and at 7, 14, 21 and 28 days for the control group and after each type of treatment. The black dots that are visible in some mice are points to facilitate the tumor irradiation. In the RT group the tumor on the right side was irradiated (black arrows), whereas in the MSC + RT group the irradiated tumor was on the left side (black arrows). The tumors on the contralateral side were protected from irradiation and just affected by the bystander effect.

