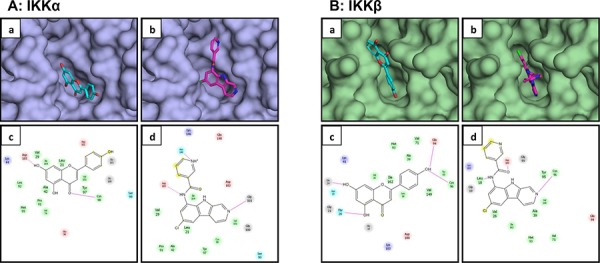
Figure 3. Molecular modeling of the interaction between apigenin and IKKα/β.

A. Apigenin a. and PS1145 b. docked in to the pocket of IKKα. Apigenin is represented as sticks with carbon atoms in cyan and oxygen atoms in red; PS1145 is represented in sticks with carbon atoms in magenta, nitrogen atoms in blue, and chlorine atom in green. Structure of IKKα is depicted as surface model. Schematic illustration of interaction between apigenin c. and PS1145 d. with different amino acid residues in the pocket of IKKα is demonstrated. B. Apigenin a. and PS1145 b. docked in to the pocket of IKKβ. Apigenin is represented as sticks with carbon atoms in cyan and oxygen atoms in red; PS1145 is represented in sticks with carbon atoms in magenta, nitrogen atoms in blue, and chlorine atom in green. Structure of IKKβ is depicted as surface model. Schematic illustration of interaction between apigenin c. and PS1145 d. with different amino acid residues in the pocket of IKKβ is shown. Details are described in ‘materials and methods’ section.
