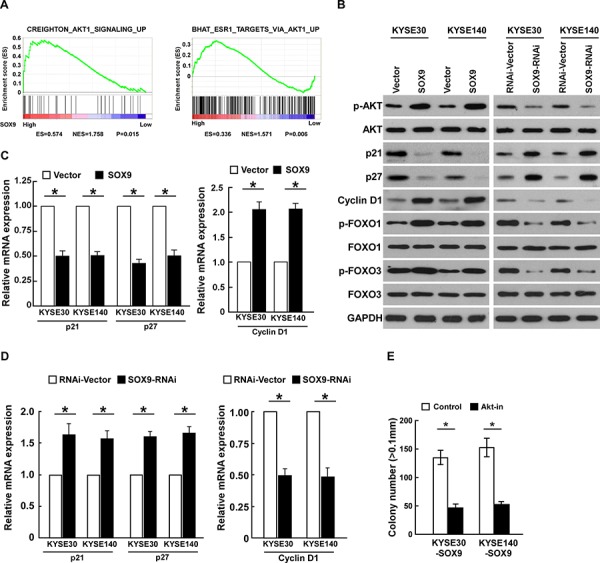
Figure 6. Overexpressing SOX9 activates the Akt signaling pathway.

A. GSEA analysis showing that SOX9 levels were significantly correlated with the Akt-downstream gene signatures (CREIGHTON_AKT1_SIGNALING_UP; BHAT_ESR1_ TARGETS_VIA_AKT1_ UP) in the TCGA database. B. Western blots of p-Akt, Akt, p21, p27, cyclin D1, p-FOXO1, total FOXO1, p-FOXO3, and total FOXO3 expression; GAPDH served as the loading control. C–D. Real-time PCR analysis of P21, P27, and cyclin D1 (CCND1) mRNA expression in ESCC cells. E. Quantification of colonies determined by anchorage-independent growth assay. Colonies larger than 0.1 mm in diameter were scored. Bars represent the mean ± SD of three independent experiments. *P < 0.05.
