
Figure 3. Chronic irradiation.
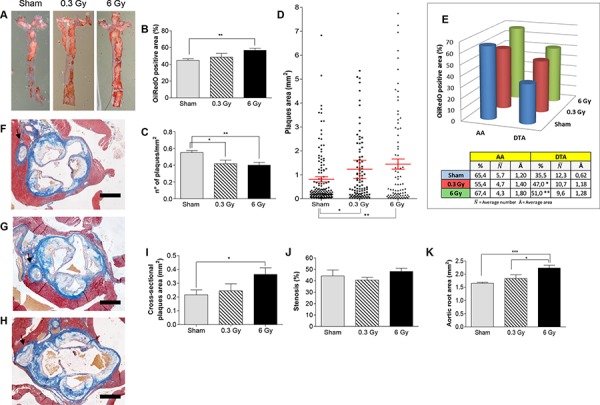
A. Representative ORO-stained aortas from female ApoE−/− mice after chronic irradiation with 0.3 Gy or 6 Gy over 300 days, and age-matched controls. Graphic representation of quantitative analyses performed on digital images from en face preparations of aortas (n = 8) showing: B. Percentage of ORO-stained aortic area. C. Plaque density. D. Plaques size. E. Regional distribution. F–H. Masson's trichrome staining of aortic root cross-sections from each experimental group. I–K. Dimensional analyses of plaques area (I), aortic stenosis (J) and aortic total area (K). Data are shown as mean ± SEM. Differences were tested with Student's t-test. *P < 0.05; **P < 0.001; ***P < 0.0001. Arrows: coronary artery. Bars: 500 μm.