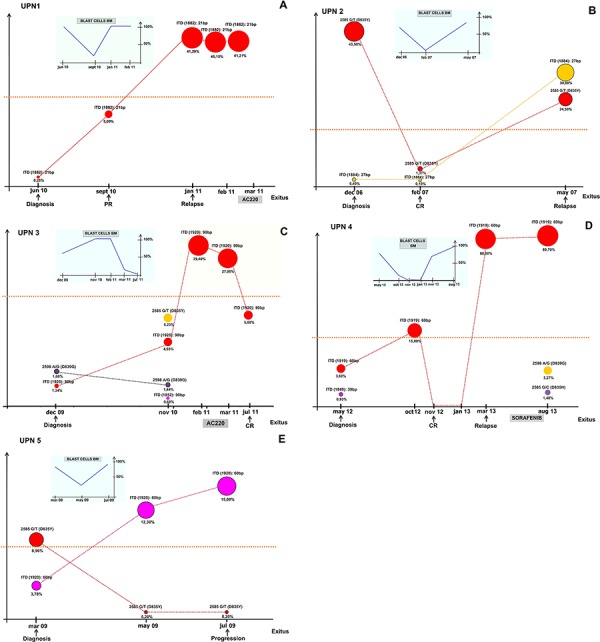
Figure 2. Evolution of FLT3 ITD+ clones during the disease course in 5 CN-AML analysed by UDS.

Circles dimensions represent the percentage of the ITD+ clones over total FLT3 RNA during follow-up; colours indicate mutated clones and the dotted lines mark the threshold of detection of routine Sanger Sequencing method. For each patient, the FLT3 mutational status and clone abundance is reported at each time point of analysis. The small graph shows the percentage of bone marrow blast cells all over the disease course. (PR: partial remission; CR: complete remission; BM: bone marrow).
