
Figure 3. Drug-sensitivity screening in vitro using NPC C666-1 cell line growth assays A. and in vivo using the PDX model (B, C).
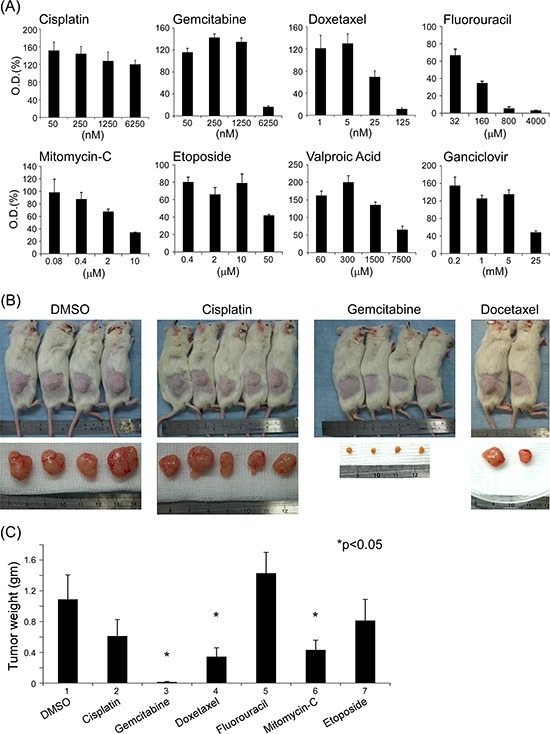
A. C666-1 cells were plated at 5 × 10⁴ cells/well in 24-well plates and incubated with or without different concentrations of tested drugs for 6 days. Cell growth was assessed using the MTT assay. Values presented in figures are mean OD590 ± SD from at least three independent reaction wells. B. NOD/SCID PDX subcutaneous tumor before and after excision. C. Xenograft tumor weight after sacrificing mice. After the tumor had been sub-implanted in NOD/SCID mice and the xenografts had reached a volume of approximately 150 mm3, animals were randomized (3–5 tumor-bearing mice per group) and various drug dose schedules, described in Materials and Methods, were administered via intraperitoneal injection. Mice were sacrificed 3 months after chemical injection or earlier in circumstances involving declining health status, morbundity, or unrelieved pain and discomfort. Tumor weights presented in figures are means ± SD from at least three independent studies. The PDX used in these studies were from the first eight passages of each line.