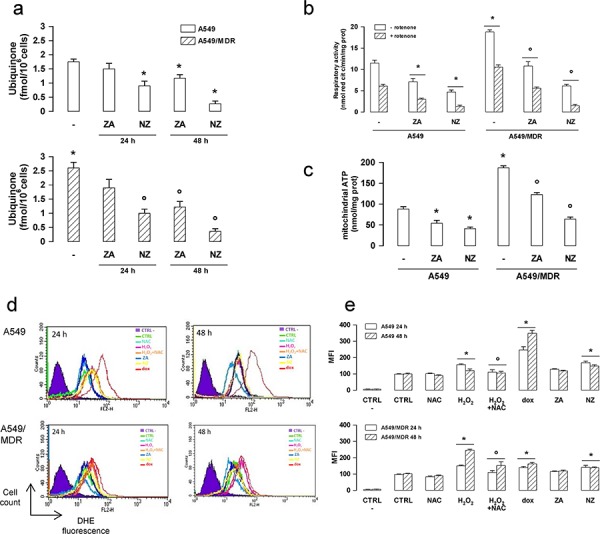
Figure 4. NZ reduces the mitochondrial respiratory chain activity and increases ROS in MDR cancer cells.

Chemosensitive human lung cancer A549 cells and their resistant counterpart A549/MDR cells were grown for 24 (panel a, d, e) or 48 h (panel a–e) in fresh medium (−), in medium containing 1 μM zoledronic acid (ZA) or 1 μM self-assembling ZA formulation (NZ). a. Cells were radiolabelled during the last 24 h with [3H]-acetate, then the de novo synthesis of ubiquinone was measured. Data are presented as means ± SD (n = 3). Versus untreated A549 cells: *p < 0.05; versus untreated A549/MDR cells: °p < 0.005. b. The ubiquinone-independent (i.e. without Complex I inhibitor rotenone) and ubiquinone-dependent (i.e. with 50 μM rotenone) electron flux between Complex I and III was measured spectrophotometrically in isolated mitochondria. Data are presented as means ± SD (n = 3). Versus untreated A549 cells: *p < 0.01; versus untreated A549/MDR cells: °p < 0.001. c. ATP levels were measured in mitochondrial extracts by a chemiluminescence-based assay. Data are presented as means ± SD (n = 3). Versus untreated A549 cells: *p < 0.05; versus untreated A549/MDR cells: °p < 0.001. d. ROS levels were measured by flow cytometry with the DHE method. H2O2 (500 μM), a ROS inducer in both chemosensitive and MDR cells, doxorubicin (1 μM, dox), a ROS inducer in chemosensitive but not in MDR cells, N-acetylcysteine (2 mM, NAC), an antioxidant agent, were used as internal controls. CTRL -: cells not labelled with DHE, used as negative control. CTRL: cells labelled with DHE, used as control of the cell autofluorescence. The figure is representative of 3 experiments. e. Mean fluorescence intensity (MFI) obtained in the flow cytometry experiments of panel d. Data were calculated with the Cell Quest software and are presented as means ± SD (n = 3). Versus CTRL: *p < 0.05; H2O2 + NAC versus H2O2 alone: °p < 0.05.
