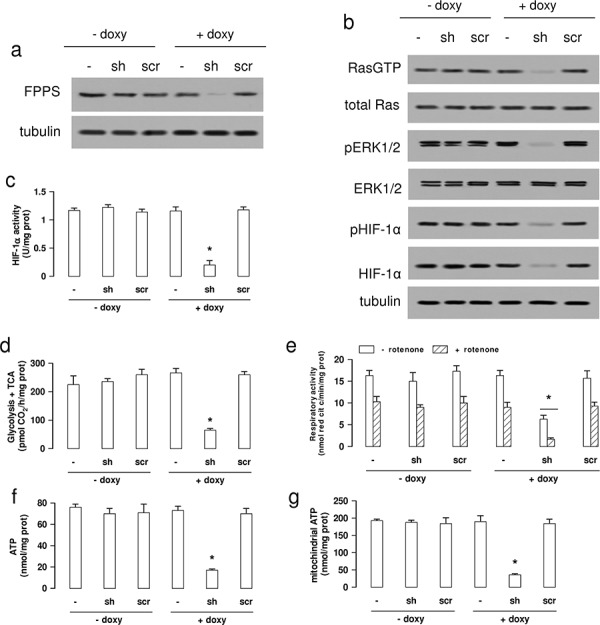
Figure 6. FPPS silencing produces the same metabolic signature of NZ in MDR cells.

Wild-type (−) A549/MDR cells, cells treated with a TetON vector containing a shRNA targeting FPPS (sh) or a non targeting scrambled shRNA (scr), were cultured 48 h in medium without (−) or with (+) 1 μg/ml doxycycline (doxy). a. Western blot analysis of FPPS. The β-tubulin expression was used as control of equal protein loading. The figure is representative of 3 experiments. b. Western blot analysis for Ras-GTP, Ras, phospho(Thr202/Tyr204, Thr185/Tyr187)-ERK1/2, ERK1/2, phospho(Ser)-HIF-1α, HIF-1α. The β-tubulin expression was used as control of equal protein loading. The figure is representative of 3 experiments. c. HIF-1α activity was measured in nuclear extracts by ELISA. Data are presented as means ± SD (n = 4). Versus untreated (− doxy) cells: *p < 0.001. d. The glucose flux through glycolysis and TCA cycle was measured by metabolic radiolabelling. Data are presented as means ± SD (n = 3). Versus untreated (− doxy) cells: *p < 0.001. e. The ubiquinone-independent (i.e. without Complex I inhibitor rotenone) and ubiquinone-dependent (i.e. with 50 μM rotenone) electron flux between Complex I and III was measured spectrophotometrically in isolated mitochondria. Data are presented as means ± SD (n = 3). Versus untreated (− doxy) cells: *p < 0.005. f–g. Whole cell (panel f) and mitochondrial (panel g) ATP was measured by a chemiluminescence-based assay. Data are presented as means ± SD (n = 3). For both panels, versus untreated (− doxy) cells: *p < 0.001.
