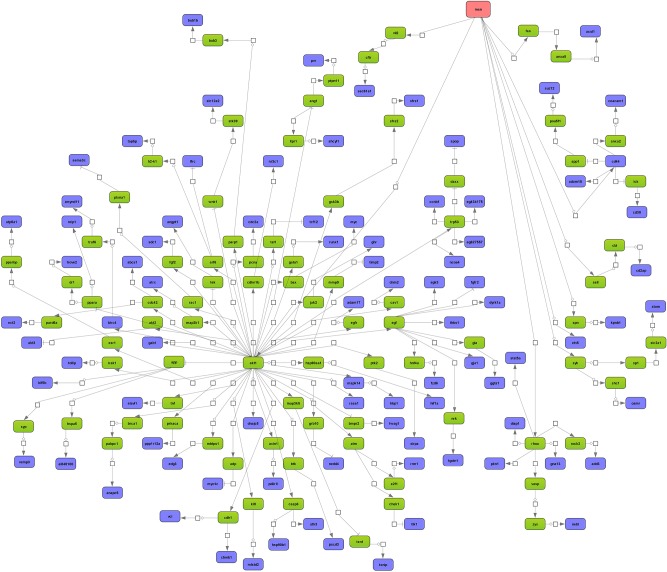
Figure 5. Master regulatory gene networks in non-tumor c-Myc transgenic mice.
Depicted is the moesin master regulatory network. Nearly 38% or 88 out of 233 of the up-regulated genes contributed to this network. The networks were constructed with the GeneXplain platform. The color coding red, blue and green represent nodes for master regulator, regulated genes and connecting genes, respectively. An activation, inactivation and regulation are denoted by the symbols  , respectively.

