Figure 5.


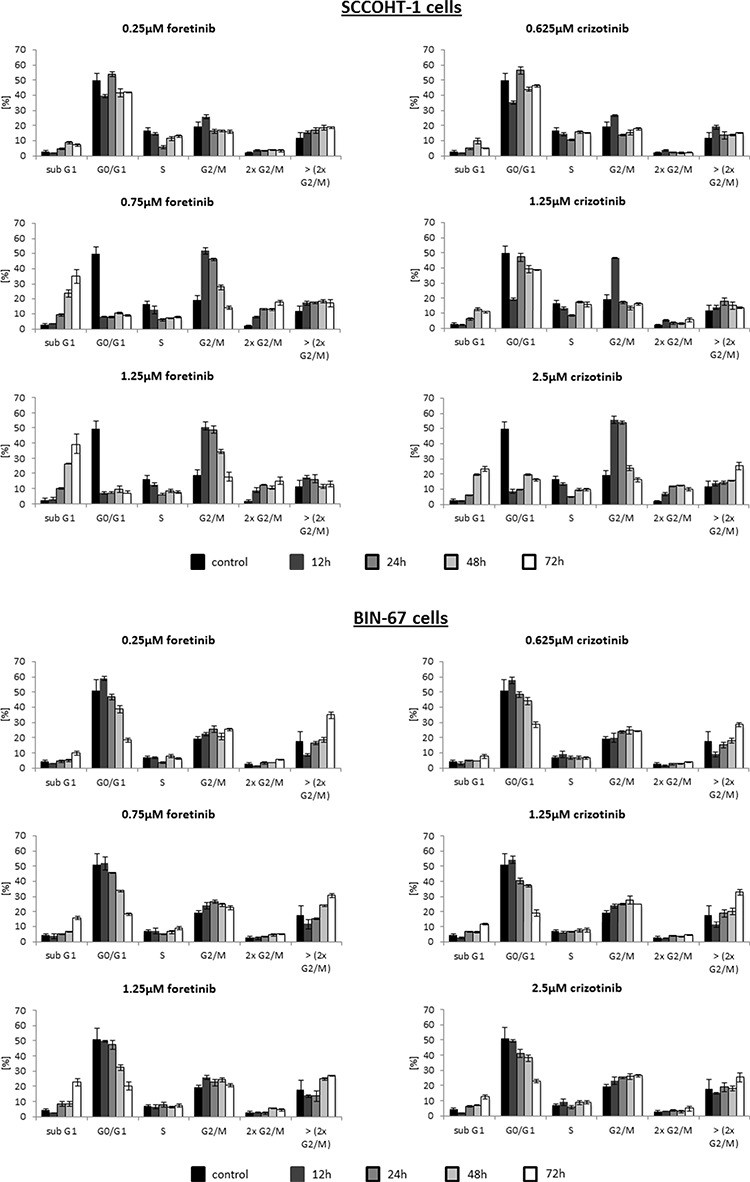
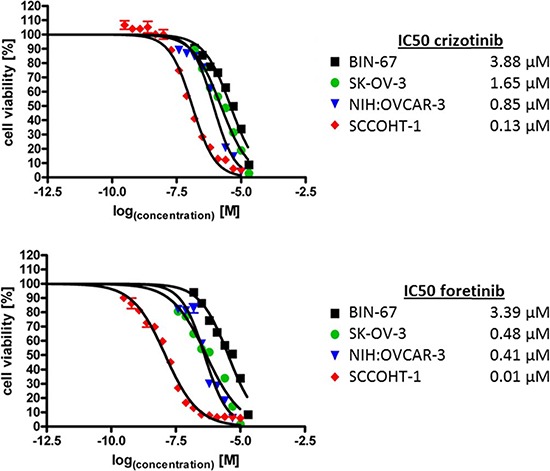
A. Cell cycle analysis was performed in SCCOHT-1, BIN-67 cells in the absence or presence of different concentrations of the c-Met inhibitors crizotinib and foretinib for 12 h up to 72 h, respectively. Quantification of the different cell cycle phases represent the mean ± s.d. (n = 3). B. SCCOHT-1GFP, BIN-67GFP, NIH:OVCAR-3GFP and SK-OV-3GFP ovarian cancer cells were incubated with different concentrations of crizotinib and foretinib for 72 h, respectively, and the proliferative capacity was measured by the fluoroscan assay. Analysis of a drug-dose-response to define IC50 concentrations for crizotinib and foretinib was performed using GraphPad Prism-6. For calculation of the drug-dose-response curves, the data were normalized to the cells-only control in culture medium and to the maximal solvent (DMSO) concentration control of the two compounds, respectively.
