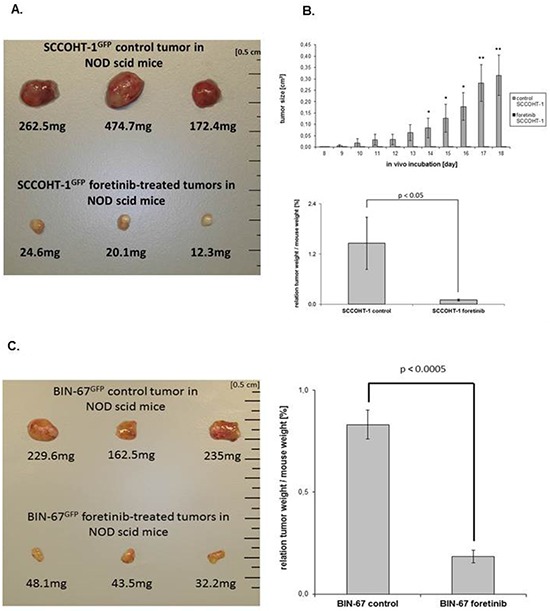
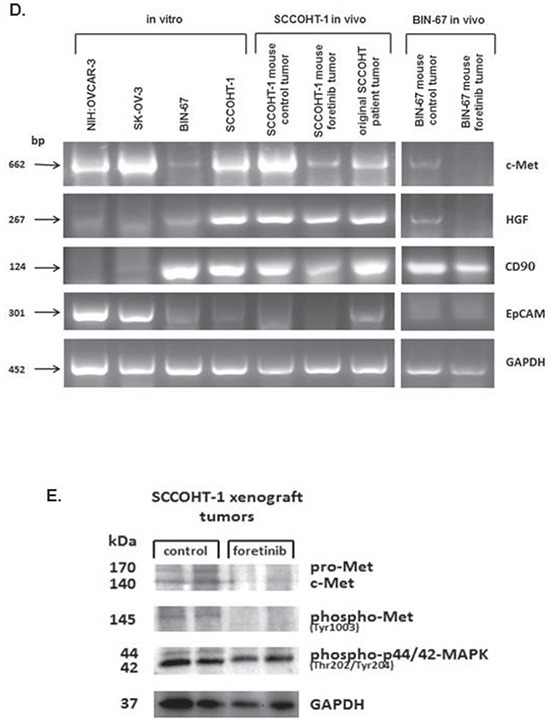
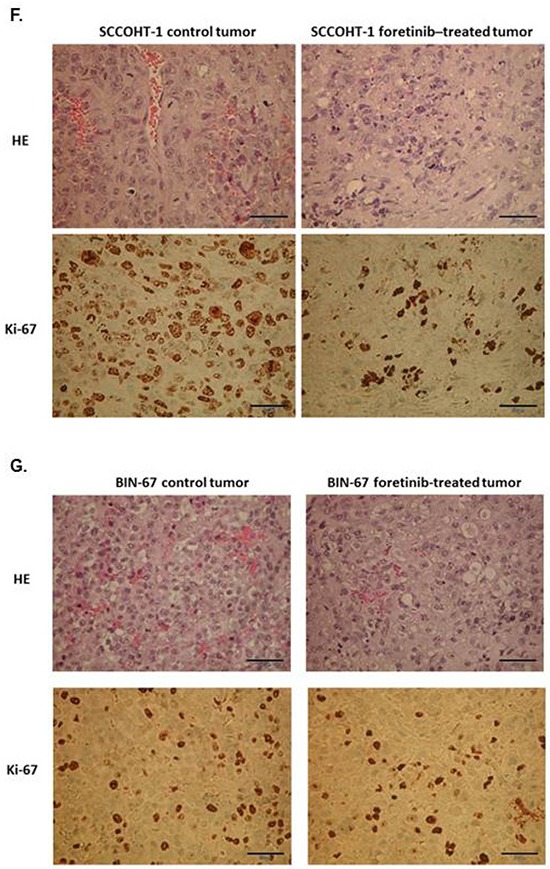
Figure 6. A. Size and weight of SCCOHT-1GFP-induced tumors in NODscid mice was compared in the absence or presence of a 10 days therapeutic approach with foretinib.


Following initial tumor detection, daily oral application was performed in 3 mice with 200 μl foretinib at a concentration of 50 mg/kg dissolved in 30% (v/v) propylene glycol, 5% (v/v) Tween 80, and 65% (v/v) of a 5% (w/v) dextrose solution in H2O. The other 3 mice were used as controls by a daily oral application of 200 μl of the solvent (30% (v/v) propylene glycol, 5% (v/v) Tween 80, and 65% (v/v) of a 5% (w/v) dextrose solution in H2O). After 10d of therapy, all 6 mice were sacrificed by cervical dislocation and the GFP-positive tumors were dissected under UV light, washed in PBS, and weighted. B. The tumor size (upper panel) of SCCOHT-1GFP-induced tumors in NODscid mice in the absence or presence of foretinib treatment was evaluated each day at 10 consecutive days of daily oral application as the mean ± s.d. for control tumors (n = 3) and foretinib-treated tumors (n = 3). Statistical analysis was calculated by unpaired Student's t-test (*P < 0.05; **P < 0.01). In the bottom panel, the relation of SCCOHT-1 tumor weight / mouse weight was calculated after 10d of subsequent treatment as the mean ± s.d. for control tumors (n = 3) and foretinib-treated tumors (n = 3). Statistical analysis was conducted by unpaired Student's t-test (*P < 0.05). C. Size and weight of BIN-67GFP-induced tumors in NODscid mice was compared in the absence or presence of a 10 days therapeutic approach with foretinib (left panel). The relation of BIN-67 tumor weight / mouse weight (right panel) was calculated after 10d of subsequent treatment as the mean ± s.d. for control tumors (n = 3) and foretinib-treated tumors (n = 3). Statistical analysis was conducted by unpaired Student's t-test (*P < 0.0005). D. The mRNA expression levels of various genes were analyzed by RT-PCR in the 4 ovarian cancer cell lines in vitro and compared to the in vivo NODscid SCCOHT-1 xenograft tumors together with the original patient tumor and to the in vivo BIN-67GFP xenograft tumors following daily oral foretinib application for 10 consecutive days. E. Analysis of c-Met protein expression and associated phosphorylation signals in 2 control tumor xenografts (#1.2 and #1.3) was compared to 2 foretinib-treated tumor xenografts (#2.3 and #2.4) by Western blot analysis. F. Tissue sections (4 μm) were prepared by hematoxylin/eosin staining (HE) of SCCOHT-1GFP-induced control and foretinib-treated tumors in NODscid mice (upper panel; bars represent 50 μm). In addition, tissue sections (4 μm) of control and foretinib-treated tumor xenografts were compared by immune histochemistry using the proliferation marker Ki-67 (lower panel; bars represent 50 μm). G. Tissue sections (4 μm) were prepared by hematoxylin/eosin staining (HE) of BIN-67GFP-induced control and foretinib-treated tumors in NODscid mice (upper panel; bars represent 50 μm). In addition, tissue sections (4 μm) of control and foretinib-treated tumor xenografts were compared by immune histochemistry using the proliferation marker Ki-67 (lower panel; bars represent 50 μm).
