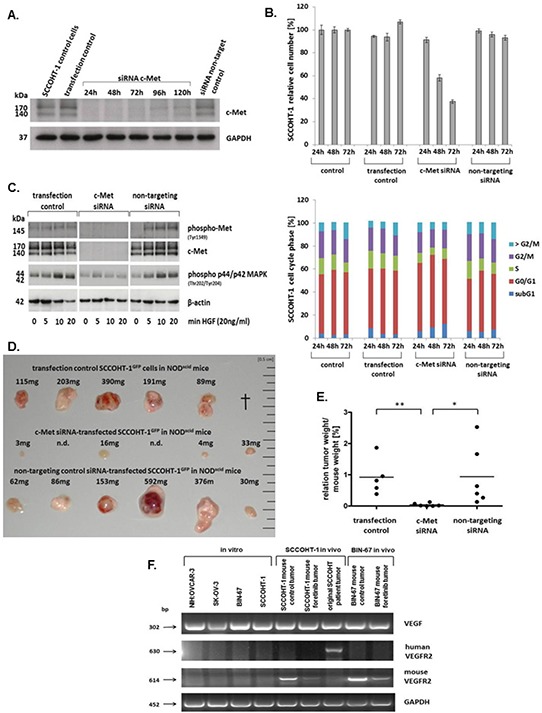
Figure 7. A. Western blot of c-Met in SCCOHT-1 steady state control cells, in cells using the transfection reagent alone (transfection control), and in cells with 25 nM of a non-targeting control siRNA was performed 24 h after transfection.

For c-Met siRNA-transfected SCCOHT-1 cells Western blots were performed between 24 h and 120 h post transfection. Analysis for GAPDH served as a loading control. B. Proliferative capacity (upper panel) and percentage of cell cycle phases (lower panel) of steady state SCCOHT-1 cells (control) was compared to cells after 24 h in the presence of the transfection reagent (transfection control), to cells transfected with c-Met siRNA (c-Met siRNA) and to cells transfected with a non-targeting siRNA (non-targeting siRNA). Cell numbers were counted for 24 h to 72 h and normalized ot the cell number of control cells (=100%). Data represent the mean ± s.d. of 3 independent experiments. C. Western blot of c-Met signaling was examined in SCCOHT-1 cells incubated with the transfection reagent for 24 h (transfection control), in cells transfected with 25 nM c-Met siRNA (c-Met siRNA), and in cells transfected with 25 nM of a non-targeting siRNA (non-targeting siRNA). In comparison to non-stimulated cells (0), the different populations were incubated with 20 ng/ml HGF for 5 min, 10 min, and 20 min, respectively. Expression of β-actin was used as a loading control. D. In vivo tumor development was evaluated after 22d of subcutaneous injection of 3 × 10⁶ SCCOHT-1GFP cells 24 h after transfection into 6 NODscid mice, respectively. Steady state control cells with transfection reagent (upper row) were compared to c-Met siRNA-mediated tumors (middle row) and tumors of a non-targeting control siRNA (lower row). In the control tumor section 1 mouse died in the course of the experiment (†, upper row). In the c-Met siRNA-transfected SCCOHT-1 cells 2 tumor developments were not detectable (n.d., middle row). Each tumor was verified by fluorescence microcopy demonstrating GFP expression. E. The relation of tumor weight / mouse weight of tumors from Fig. 7D was calculated Statistical analysis was conducted by unpaired Student's t-test (*P < 0.05; **P < 0.005). F. The mRNA expression levels of VEGF and human and mouse VEGFR2 was analyzed by RT-PCR in the 4 ovarian cancer cell lines in vitro and compared to the in vivo NODscid SCCOHT-1 and BIN-67GFP xenograft tumors together with the original patient tumor of SCCOHT-1 cells. GAPDH expression levels served as a control.
