
Figure 1. Effect of hypoxia in cells isolated from normal or tumor primary tissue.
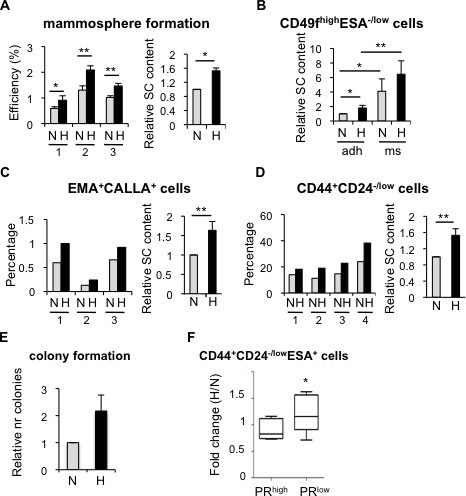
A. Normal primary epithelial cells cultured in suspension in normoxia or hypoxia for 7 days. Mammosphere formation efficiency of cells from four different breast specimens (left graph) and mean ±SD of three experiments (right graph) are represented as the percentage of mammospheres formed with respect to the number of plated cells, and as fold change between normoxia and hypoxia, respectively. B. Percentage of CD49fhighESA−/lowcells in normal breast epithelial cells cultured in normoxia or hypoxia, in adherent (adh) or suspension (ms) conditions. C., D. Percentage of EMA+CALLA+ and CD44+CD24−/low cells in normal breast epithelial cells cultured in normoxia or hypoxia. E. Relative number of colonies formed in Matrigel by primary normal epithelial cells cultured in normoxic or hypoxic conditions. F. Percentage of CD44+CD24−/lowESA+ cells found in primary tumor cells cultured as mammospheres in normoxic or hypoxic conditions and represented as fold change between hypoxia and normoxia. The graph shows the mean ±SD of the fold changes grouped based on high or low ER transcriptional activity (PRhigh or PRlow, respectively, low was defined as less than 11% expression) *P < 0.05 (P = 0.031).