
Figure 3. Expression levels of NK cell receptors.
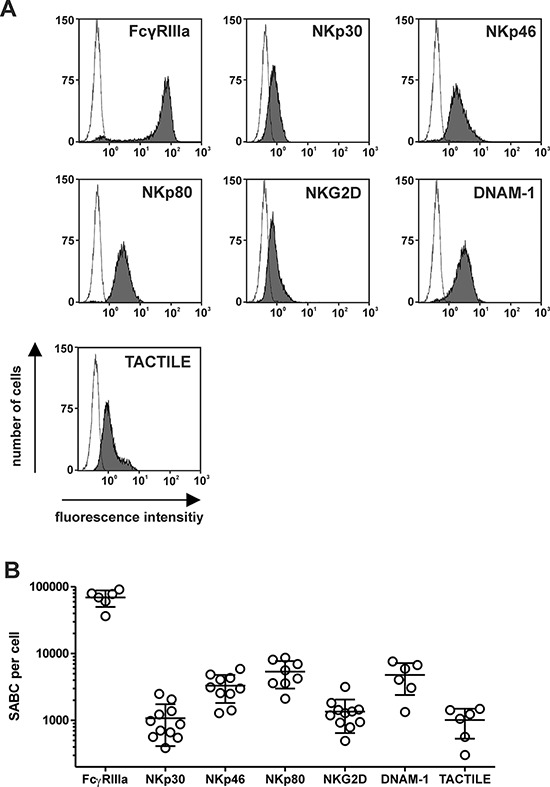
A. Surface expression of activating surface receptors by NK cells was analyzed with specific murine antibodies of the indicated specificities (grey) at saturating concentrations or an isotype control antibody (black line) and flow cytometry. Representative experiments are shown. B. Specific antibody binding capacity (SABC) per cell was determined by calibrated flow cytometry using NK cells from different healthy donors. Mean values ± SEM are indicated.