
Figure 5. Cytotoxic effects induced by combinations of immunoligands and therapeutic antibodies.
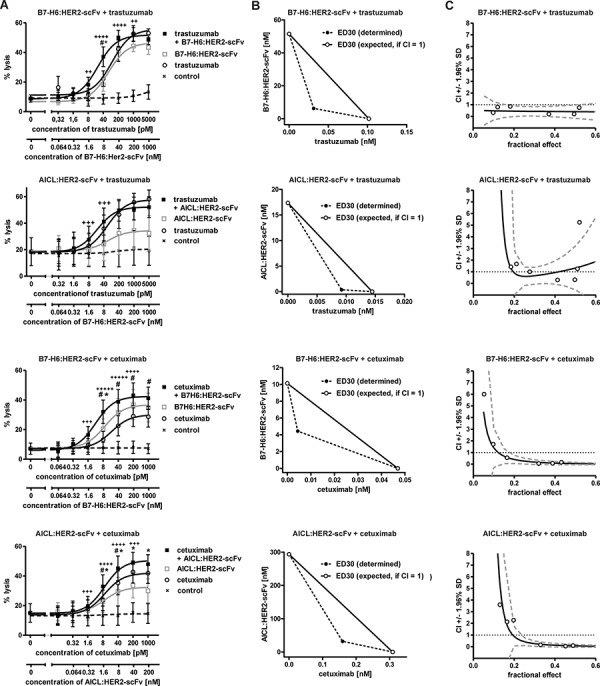
A. Dose effect curves for pairwise combinations between the immunoligands and the therapeutic antibodies trastuzumab and cetuximab. The effects obtained in combination were compared to the effects achieved by the single molecules at varying concentrations. SK-BR-3 cells were employed as target cells and MNC served as an effector cell source. Rituximab was employed as an IgG1 control antibody. Data points represent mean values ± SEM from at least four independent experiments. Synergistic effects are indicated according to their strength (+++++, CI < 0.1, ++++, CI < 0.3; +++, CI < 0.7; ++, CI < 0.85). Statistically significant differences between effects induced by combinations or the immunoligands (#P < 0.05) or by the antibodies as single agents (*P < 0.05) are indicated. B. Analysis of synergy by isobolograms. The experimentally determined doses resulting in 30% (ED30) target cell lysis were compared with the calculated doses which were expected, if additive effects were assumed (CI = 1). C. CI values at varying fractional effects. Actual combination data points (open circles) represent mean values of at least four independent experiments [black line, computer simulated CI values; dashed grey line, SD; dotted black line, line of additivity (CI = 1)].