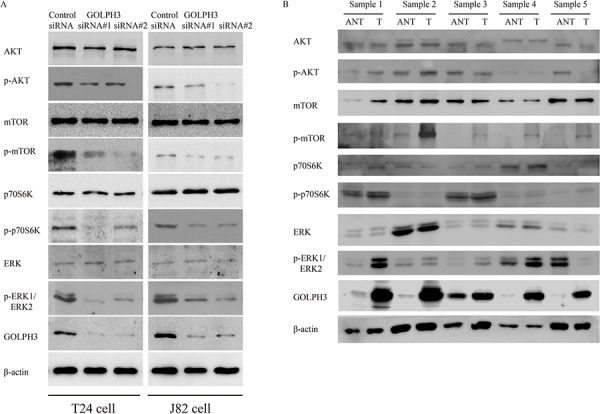
Figure 4. The effects of GOLPH3 inhibition on AKT/mTOR signaling.

Western blot analysis of AKT/mTOR signaling (p-AKT, total AKT, p-mTOR, total mTOR, p-p70S6K, total p70S6K), p-ERK1/ERK2, and total ERK in GOLPH3 siRNA-infected cells A. and 5 paired primary bladder cancer tissues (T) and adjacent noncancerous tissues (ANT) B.
