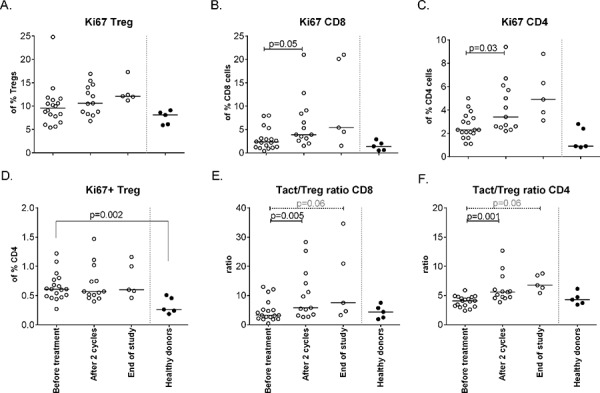
Figure 4. Changes in Ki67 expression on different cell subsets upon treatment.

Activation status of different T-cell subsets, as defined by Ki67+, was measured by flow cytometry at baseline, after 2 cycles and at end of study. A. The % of activated Tregs upon treatment. B. The percentage of activated CD8+ cells increases upon treatment (p = 0.05). C. Activated CD4+ T-cells are increased after therapy (p = 0.03). D. Activation status of CD4+ Tregsshowing less activated cells in patients compared to healthy donors. E. The ratio between activated CD8+ T-cells and activated Tregs increases upon treatment with the the balance in favor of activated CD8+ T-cells. F. The ratio between activated CD4+ T-cell and activated Tregs is in favor of the activated CD4+ T-cell.
