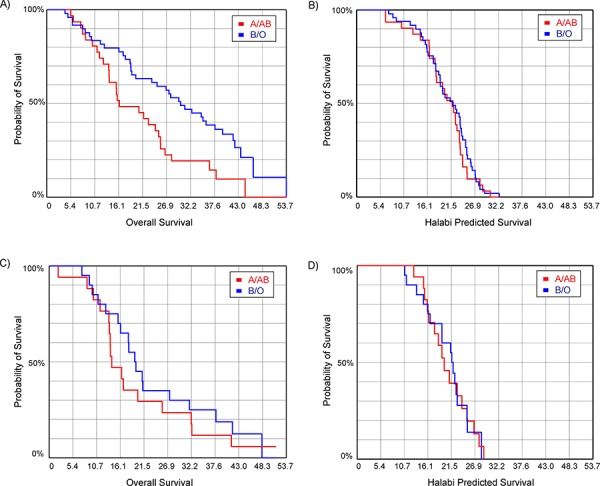
Figure 3. Kaplan-Meier survival curves evaluating the influence of blood type.

A. overall survival for prostate cancer patients treated with PROSTVAC (p = 0.006); B. Halabi predicted survival for patients treated with PROSTVAC (p = 0.53); C. overall survival for patients in the control arm (p = 0.41); D. Halabi predicted survival for patients in the control arm (p = 0.98).
