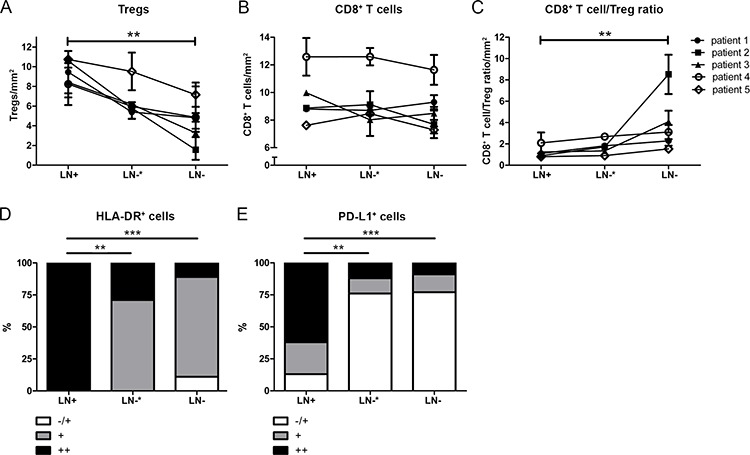
Figure 5. Frequencies of immunosuppressive cell subsets in tumor positive lymph nodes (LN+), proximal (to the LN+) uninvolved lymph nodes (LN−*) and more distal uninvolved lymph nodes (LN−) from patients with cervical cancer.

A. High levels of Tregs in tumor-positive lymph nodes (LN+) and tumor-negative lymph nodes (LN−), located in the same region as LN+ (LN−*), and significantly lower levels of Tregs in LN− compared to LN+. B. Constant levels of CD8+ T cells in LN+, LN−*, and LN−. C. Low CD8+ T cell/Treg ratios in LN+ and LN−*, and higher CD8+ T cell /Treg ratios were found in LN− compared to LN+. D. The distribution of HLA-DR+ cells in LN+ was significantly different compared to LN−* and LN−. E. The distribution of PD-L1+ cells in LN+ was significantly different compared to LN−* and LN−. Minimal- (−/+); moderate- (+); and high numbers (++) of positive cells. One-way ANOVA Friedman test P-value in (A), (B), and (C), Fisher's Exact test P value in (D) and (E) (**P = 0.001 to 0.01 and ***P < 0.001).
