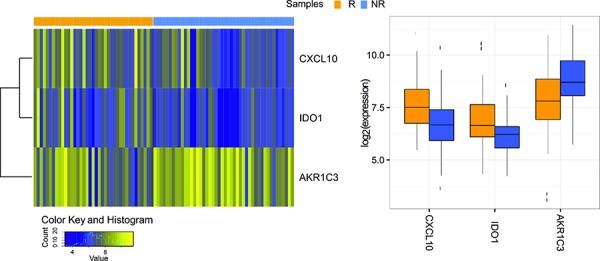
Figure 1. Three genes were validated using Multtest package (Benjamini–Hochberg procedure with p = 0.05 assumption).

As shown by the heatmap of gene expression profiles in considered samples (left) and by the Boxplot (right), IDO1 and CXCL10 genes are up-regulated in Responders group, while AKR1C3 is down-regulated.
