
Figure 1. Down-regulation of EMMPRIN reduces tumor growth and BMDC recruitment.
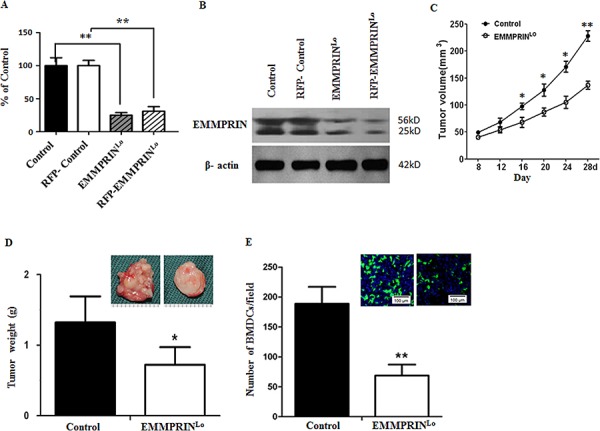
A, B. qRT-PCR (A) and Western Blot (B) analyses of EMMPRIN expression in LLC cells used in this study. In both analyses, β-actin was used as an internal control. For qRT-PCR study, experiments were carried out in triplicate and the standard deviation is denoted using error bars. C. Growth curve of control LLC tumors (solid circle) and EMMPRINlo-LLC tumors (open circle). Data is presented as the mean of tumor sizes and the standard error is denoted using error bars (n = 9). D. Average weights of control LLC tumors and EMMPRINlo-LLC tumors at day 28 after inoculation. Representative images of a control LLC tumor (left) and an EMMPRINlo-LLC tumor (right) are shown in the upper right corner. E. Average number of BMDC clusters per microscopic field in control LLC tumors and EMMPRINlo-LLC tumors. Representative images of GFP-expressing BMDC cluster in control LLC tumors (left) and EMMPRINlo-LLC tumors (right) are shown in the upper right corner. Cell nuclei were stained with DAPI. Standard deviation is denoted using error bars (n = 27). * represents P < 0.05. ** represents P < 0.001.