
Figure 3. Down-regulation of EMMPRIN decreases tumor vascularization.
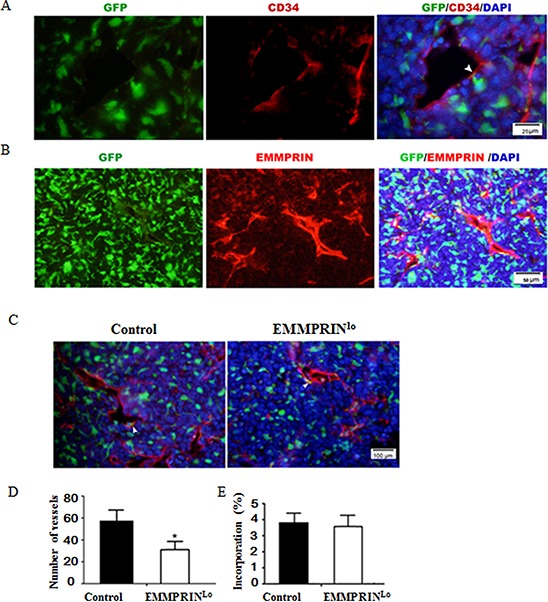
A. Representative immunofluorescence images of tumor sections stained with CD34 antibody. Green and red represent BMDCs and CD34+ vessel cells, respectively. B. Representative immunofluorescence images of tumor sections stained with EMMPRIN antibody. Red represented EMMPRIN+ cells. C. Representative images of a control LLC tumor (left) and EMMPRINlo-LLC tumor (right). Green and red represent BMDCs and CD34+ vessel cells, respectively. EMMPRIN and CD34 are cell surface molecules. In A-C, EMMPRIN and CD34 stained endothelial cells which were well aligned with blood vessels. As such, both EMMPRIN and CD34 staining appeared to be linear and not clearly outline cells. D. Average numbers of vessels in tumors per microscopic field. E. Average percentages of BMDCs incorporated into neovessels per microscopic field. In the tumor slides with CD34 antibody staining, neovessel cells were stained red and BMDCs were labeled green with GFP. Only these green BMDCs cells co-localized with red vessel cells are counted as “incorporated BMDCs”. Data is presented as the mean and the standard deviation is denoted using error bars (n = 27). * represents P < 0.05.