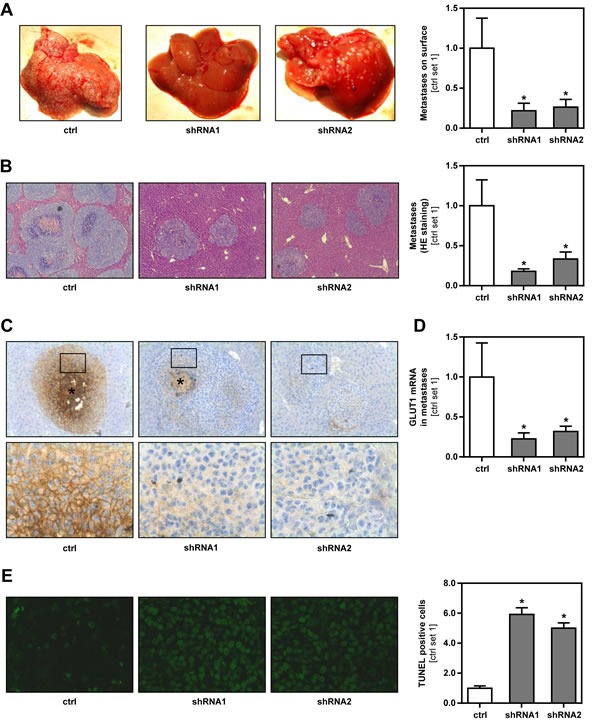
Figure 4. Effect of GLUT1 inhibition on hepatic metastasis of B16 melanoma cells in vivo.

Hepatic metastasis of GLUT1 suppressed and control B16 cell clones were analyzed in a syngeneic model in Bl6/N mice. A. Representative images of macroscopically visible metastases on the liver surface (left panel). Bar graphs depicting the number of metastases derived from GLUT1 suppressed and control cell clones on the liver surface (control set 1) (right panel). B. Representative images of HE stained hepatic tissue sections showing intrahepatic metastases (left panel). Bar graphs depicting the number of intrahepatic metastases formed by GLUT1 suppressed and control cell clones (control set 1) (right panel). C. Immunohistochemical GLUT1 staining of hepatic metastases (*: central necrosis). Squares depict areas which are shown as higher-magnification field in the lower panel. D. quantitative RT-PCR analysis of GLUT1 mRNA expression in hepatic metastases. E. TUNEL staining of hepatic metastases derived from GLUT1 suppressed and control cell clones (left panel). Bar graphs depicting the number of TUNEL positive cells (control set 1) (right panel). (*p < 0.05 compared to control).
