
Figure 2. Molecular characterization of the EMT process in Sdhb−/− imCC.
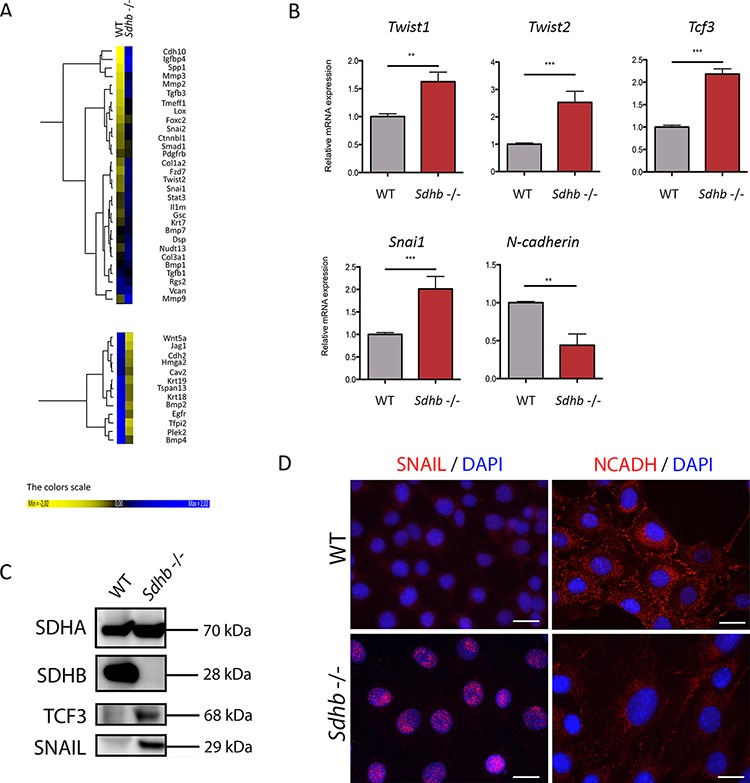
A. Heat map samples of the most differentially expressed EMT associated genes between WT and Sdhb−/− imCC. B. qRT-PCR analyses showing Twist1, Twist2, Tcf3, and Snai1 inductions as well as and N-cadherin loss of expression in Sdhb deficient imCC compared to WT cells. **p = 0.0079 and p = 0.0099; ***p = 0.0002. Data are shown as fold change relative to WT C. SNAIL and TCF3 were studied at protein level using western blotting and specific antibodies. D. SNAIL and N-Cadherin were studied using immunofluorescence and specific antibodies. Scale bar 20 μm See also Supplementary Figures 2 and 3