
Figure 4. KRT19 rescue after lentiviral transduction and its functional consequences.
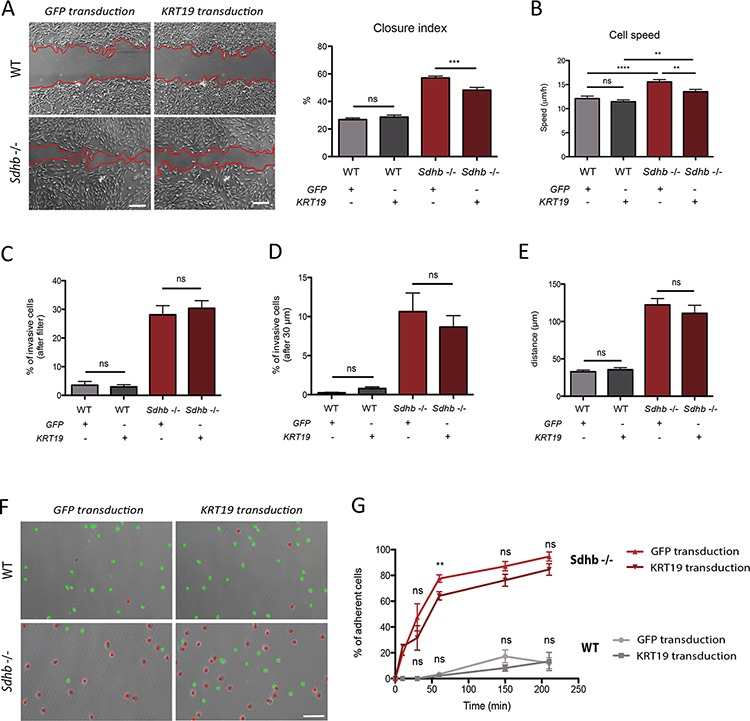
A. Collective migration was followed using a wound scratch assay. Cells were studied for migration during 10 hours. Migration is represented as the closure percentage of the wound. Scale bar 250 μm. ***p = 0.0002; ns, non-significant. B. Individual cells speed was estimated by tracking cell nucleus during 12 hours. **p = 0.0013; ns, non-significant. C. Quantification of cell abilities to pass through the filter. ns, non-significant. D. Quantification of cell invasion, cells were considered invasive beyond 30 μm. ns, non-significant. E. Mean distance travelled by cells into Matrigel matrix. ns, non-significant. F. Cell adhesion abilities were measured by counting adherent (marked with red dots) versus non-adherent (marked with green dots) cells one hour after plating. Scale bar 125 μm. G. Adhesion course: quantification of cell adhesion during 210 minutes. **p = 0.0013; ns, non-significant See also Supplementary Figures 6 and 7.