
Figure 2. Accumulation of IL-17 producing MCs in HDC−/− mice OVA intestinal allergy.
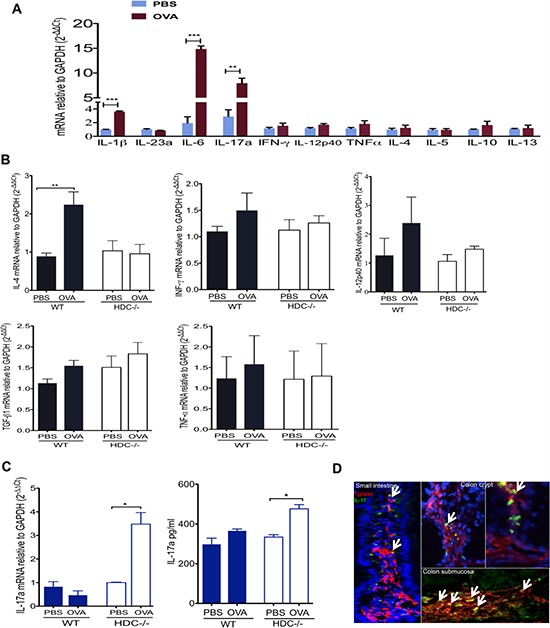
A. Comparison of HDC−/− intestinal MC TH1, TH2, and inflammatory cytokine genes expression between OVA and PBS treated groups (n = 4/group). B. IL-4, IFN-γ, IL-12p40, TGF-β1 and TNF-α expression in WT (n = 3) and HDC−/− (n = 5) small intestine tissue, mice treated either OVA or PBS. C. IL-17 elevated in HDC−/− mice (n = 5) but not WT mice (n = 5) treated with OVA, bar graphs show IL-17a mRNA expression in the small intestine (Left), and IL-17a protein level in sera (Right). D. Representative frozen slides co-stained with tryptase and IL-17a from OVA allergy HDC−/− mice (n = 3) in small intestine and colon. Arrows indicate tryptase+IL-17+ MCs. Data are representative of 2–3 independent experiments.