
Figure 3. Survivin and BIM expression in response to lapatinib.
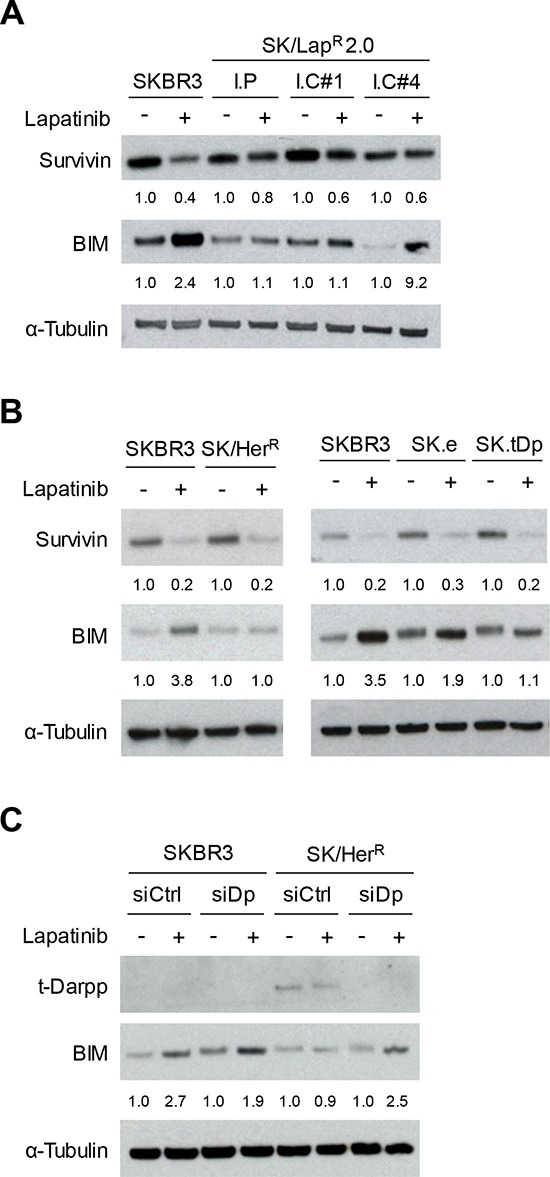
Western analysis of Survivin and BIM protein levels after 24 hour exposure to 0.1% DMSO (−) or 2 μM lapatinib (+) in lapatinib-resistant cells (A), cells overexpressing t-Darpp (B), or SK/HerR cells transiently transfected with siRNA targeted to GFP (siCtrl) or Darpp-32/t-Darpp (siDp) for 72 hours (C). α-Tubulin was used as a loading control. Protein expression was quantified using ImageJ software. Data was normalized to α-Tubulin levels and expressed as the fold change in protein level after lapatinib treatment, relative to the DMSO control, for each cell line.