
Figure 5. Colony formation by SK.tDp cells exposed to lapatinib.
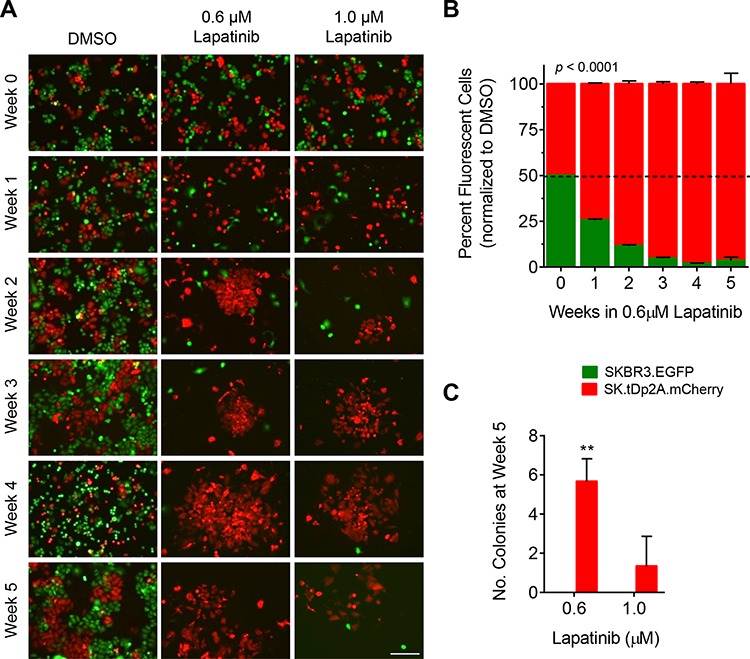
SKBR3 cells stably expressing EGFP (SKBR3.EGFP) and SK.tDp cells stably expressing mCherry (SK.tDp2A.mCherry) were co-cultured at a ratio of 1:1 and continuously exposed to 0.1% DMSO, 0.6 μM lapatinib or 1.0 μM lapatinib for 5 weeks. DMSO-treated cells were split twice-weekly (1:4 dilution). Lapatinib-treated cells were grown without passaging. Each experiment was run in triplicate. A. Co-cultured cells were imaged weekly for fluorescence (10x magnification, scale bar = 200 μm). Shown are representative fields for each condition and time point. B. The percentage of EGFP-positive and mCherry-positive cells in each co-culture was quantitatively measured weekly via flow cytometry. Data was normalized to the mean percentage of EGFP-positive and mCherry-positive cells, respectively, in DMSO-treated co-cultures; mean ± standard deviation. C. For each co-culture the number of fluorescent colonies was counted after 5 weeks in lapatinib; mean ± standard deviation, **p ≤ 0.01.