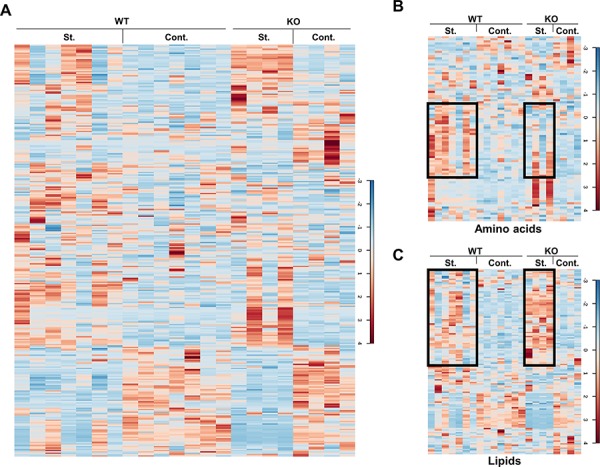
Figure 1. Heat maps of the metabolites.

Liver samples of the control and starved mice were extracted and prepared for the MS analysis. The levels of the total 347 metabolites are shown as a heat map in A. Heat maps of the metabolite subgroups, amino acids and lipids, are shown in B. and C. The black boxes indicate the extensive changes of the metabolites under different conditions. St.: starvation; Cont.: control.
