
Figure 4. SGI-1776 enhances the suppressive effects of imatinib mesylate on BCR-ABL expressing cells.
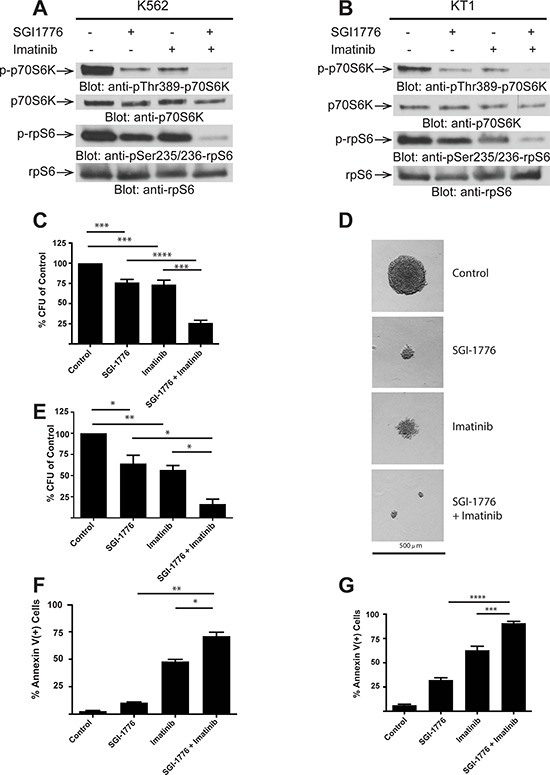
A. K562 cells were treated with control (DMSO), SGI-1776 (3 μmol/L) or imatinib (0.5 μmol/L) alone or in combination for two hours, and equal amounts of cell lysates were resolved by SDS-PAGE and immunoblotted with the indicated antibodies. The immunoblots with antibodies against the phosphorylated forms of the proteins or against the total proteins were from lysates from the same experiments analyzed in parallel by SDS-PAGE.B. KT1 cells were treated with control (DMSO), SGI-1776 (3 μmol/L) or imatinib (1 μmol/L) alone or in combination for two hours, and equal amounts of cell lysates were resolved by SDS-PAGE and immunoblotted with the indicated antibodies. The immunoblots with antibodies against the phosphorylated forms of the proteins or against the total proteins were from lysates from the same experiments analyzed in parallel by SDS-PAGE. C. K562 cells were plated in methylcellulose in the presence of control (DMSO), SGI-1776 (10 μmol/L) or imatinib (0.5 μmol/L) or in combination for approximately seven days. Leukemic progenitor colony formation (CFU-L) was assessed in clonogenic assays in methylcellulose. Data are expressed as a percentage of DMSO control-treated cells. Shown are the means + SE of six independent experiments. ***p < 0.001, ****p < 0.0001 using a paired t-test.D. Representative colonies treated with control (DMSO), SGI-1776, imatinib, and SGI-1776 plus imatinib, from the experiments described in panel C is shown (x 10 magnification). E. LAMA-84 cells were plated in methylcellulose in the presence of control (DMSO), SGI-1776 (3 μmol/L) or imatinib (0.5 μmol/L) alone or in combination. Leukemic progenitor colony formation (CFU-L) was assessed in clonogenic assays in methylcellulose. Data are expressed as a percentage of DMSO control-treated cells. Shown are the means + SE of five independent experiments. *p < 0.05, **p < 0.01 using a paired t-test. F. K562 cells were treated with control (DMSO), SGI-1776 (3 μmol/L) or imatinib (0.5 μmol/L) alone or in combination for 24 hours. The percentage of apoptosis was determined by flow cytometry using Annexin V and DAPI stain. Shown are the means + SE of three independent experiments. *p < 0.05, **p < 0.01 using a paired t-test G. KT1 cells were treated with control (DMSO), SGI-1776 (3 μmol/L) or imatinib (1 μmol/L) alone or in combination for 24 hours. The percentage of apoptosis was determined by flow cytometry using Annexin V and DAPI stain. Shown are the means + SE of three independent experiments. ***p < 0.001, ****p < 0.0001 using a paired t-test.