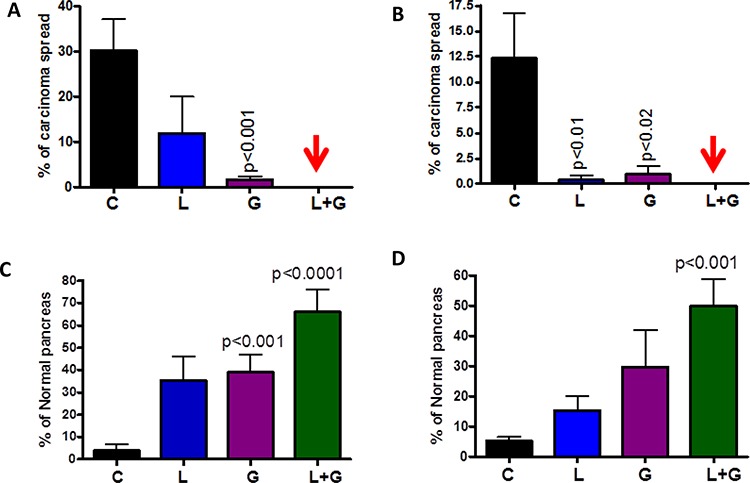
Figure 4. Effect of L, G and L+G on carcinoma percentage.

A–B. Effect of L, G, and L+G on the percentage of pancreata with carcinoma (A-male, B-female). C–D. Effect of L, G, and L+G on the percentage of normal appearing pancreata (C-male, D-female). The data in the panels were analyzed by unpaired t-test with Welch's correction. Values are considered statistically significant at p < 0.05.
