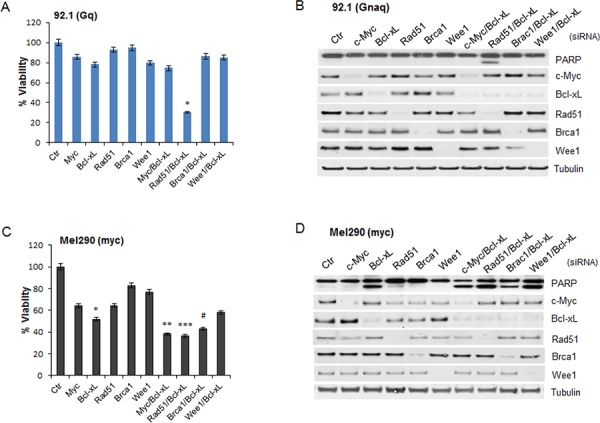
Figure 4. Effect of silencing of selected JQ1-regulated genes.

The indicated JQ1-regulated genes were silenced in the Gnaq-mutant cell line 92.1 (top) and in the myc-amplified cell line Mel290 (bottom). A. and C. siRNA transfected cells were plated in 96 well plates in triplicates and assayed for cell viability after 72 hours. Viability is calculated as percentage of cells transfected with a control siRNA (Ctr). Graphs are representative of three independent experiments. Bars, mean ± sd. *P < 0.001, **P < 0.01; ***P < 0.05, comparing the effect of gene-specific silencing versus control siRNA-transfected cells. The down-regulation of each gene was analyzed by immunoblotting for 92.1 B. and Mel290 cells D.
