
Figure 2. Methylation and expression status of NKD2 in primary gastric cancer and their prognostic value.
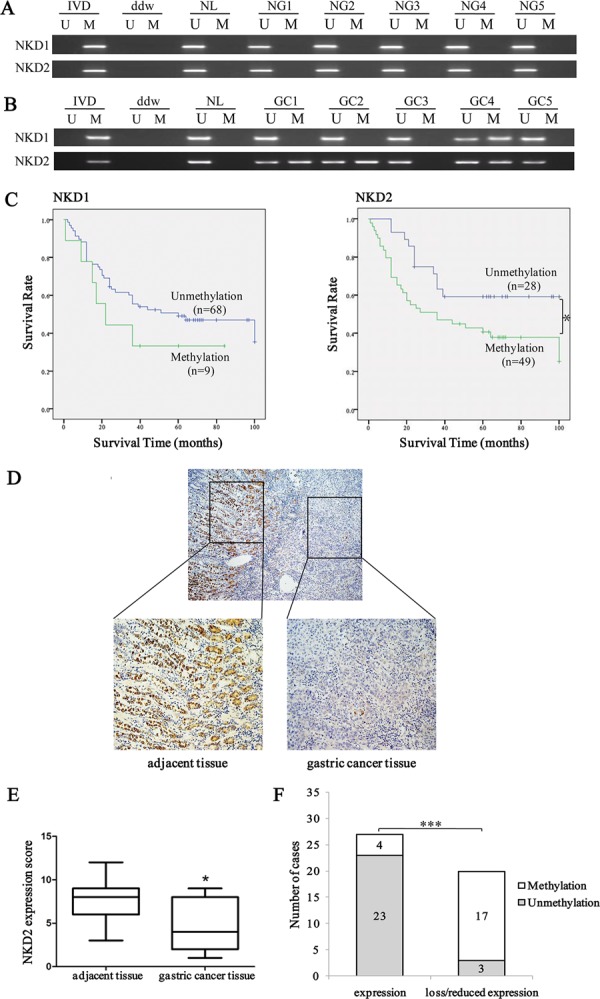
A. MSP results of NKD1 and NKD2 in normal gastric mucosa. NG: normal gastric mucosa. B. Representative results of MSP for NKD1 and NKD2 in primary gastric cancer samples. GC: primary gastric cancer samples. C. The survival of gastric cancer patients in methylated and unmethylated NKD1 and NKD2 cases. Methylation of NKD2 was associated with poor prognosis (*P < 0.05). D. Representative IHC results show NKD2 expression in gastric cancer and adjacent tissue samples (upper: ×40; lower: ×200). E. NKD2 expression scores are shown as box plots, horizontal lines represent the median score; the bottom and top of the boxes represent the 25th and 75th percentiles, respectively; vertical bars represent the range of data. Expression of NKD2 was significantly different between adjacent tissue and gastric cancer tissue in 47-matched primary gastric cancer samples. *P < 0.05. F. The expression of NKD2 and DNA methylation status is shown as a bar diagram. Reduced expression of NKD2 was significantly associated with promoter region hypermethylation. ***P < 0.001.