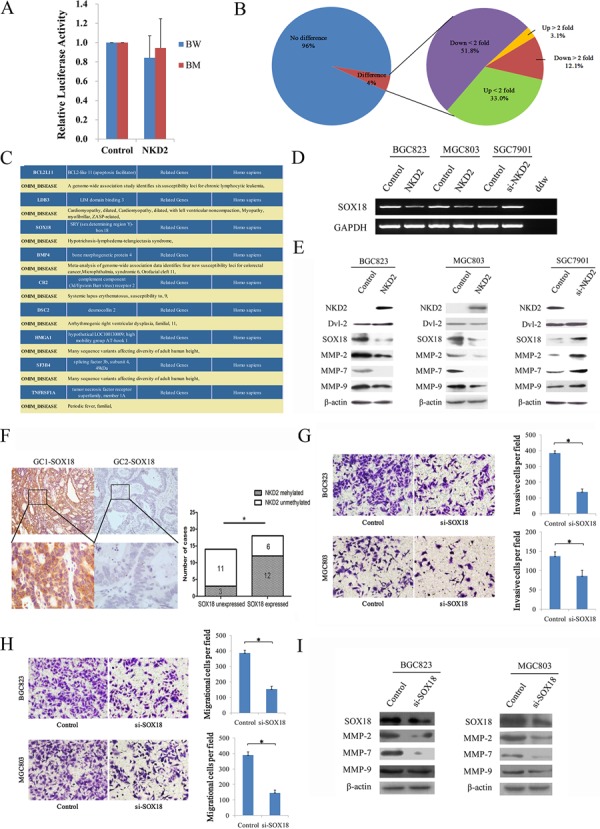
Figure 6. NKD2 suppresses SOX18 and MMP-2,7,9 expression in gastric cancer.

A. Results of TCF/LEF luciferase reporter assay. Relative luciferase activity (a ratio of firefly luciferase to renilla luciferase) was not changed after co-transfection of NKD2 with wild type or mutant type β-catenin in BGC823 cells (P > 0.05). The experiment was repeated three times. B. Gene expression array shows differentially expressed genes in NKD2 re-expressed and unexpressed BGC823 cells. The percentage of up-regulated or down-regulated genes are shown in the pie chart. Angle of the sector: the percentage of each category. C. BCL2L11, LDB3, SOX18, BMP4, CR2, DSC2, HMGA1, SF3B4 and TNFRSF1A genes were associated with disease according to DAVID software (http://david.abcc.ncifcrf.gov/home.jsp). D. The expression of SOX18 was detected by semi-quantitative RT-PCR in NKD2 unexpressed and re-expressed BGC823 and MGC803 cells. The results were further validated by knockdown of NKD2 in SGC7901 cells. E. The expression levels of NKD2, Dvl-2, SOX18 and MMP-2,7,9 were detected by western blot in NKD2 unexpressed and re-expressed BGC823 and MGC803 cells. The results were validated by knocking down NKD2 in SGC7901 cells. F. Representative IHC results show SOX18 expression in primary gastric cancer (upper: ×100; lower: ×400). NKD2 is methylated in GC1 and unmethylated in GC2. The correlation of SOX18 expression and NKD2 methylation status is shown as a bar diagram. The expression of SOX18 is associated with NKD2 methylation significantly. GC: primary gastric cancer samples. *P < 0.05. G. Cell invasion in BGC823 and MGC803 cells before and after knockdown SOX18. The invasive cell number is presented by bar diagram. Each experiment was repeated for three times. *P < 0.05. H. Cell migration in BGC823 and MGC803 cells before and after knockdown SOX18. The migrational cell number is presented by bar diagram. Each experiment was repeated for three times. *P < 0.05. I. The expression levels of SOX18 and MMP-2,7,9 were detected by western blot before and after knockdown SOX18 in BGC823 and MGC803 cells.
