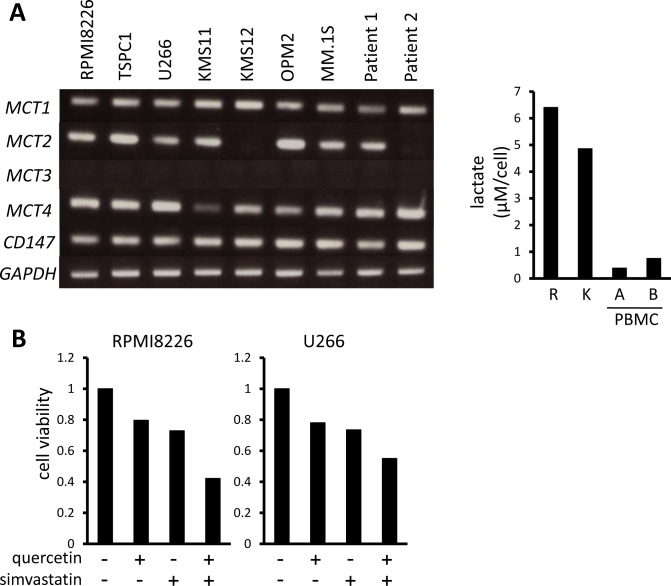
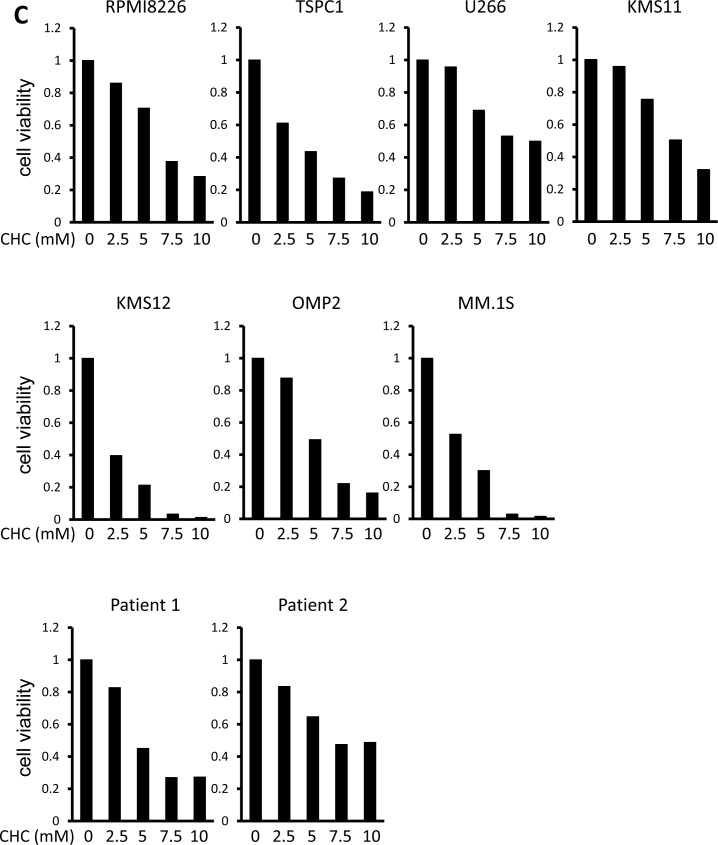
Figure 1. MCT expression and cytotoxic effects of MCT blockade on MM cells.
A. The expression of MCT1, MCT2, MCT3, MCT4 and CD147 was analyzed by RT-PCR using total RNA isolated from MM cell lines as indicated and primary MM cells from 2 patients with MM (left). GAPDH was used as an internal control. RPMI8226 cells (R), KMS11 cells (K), PMBCs from two healthy donors were incubated for three hours, and supernatants were assayed for lactate content (right). Lactate concentrations were divided by cell numbers as counted by trypan blue assay. B. MM cell lines were incubated for 24 hours with 50 μM quercetin and/or 10 μM simvastatin and then subjected to a WST8 viability assay. Ratios of viable cells from the baseline were shown. C. MM cell lines and primary MM cells were cultured for 24 hours under indicated conditions, then subjected to a WST8 viability assay. Ratios of viable cells from the baseline were shown.


