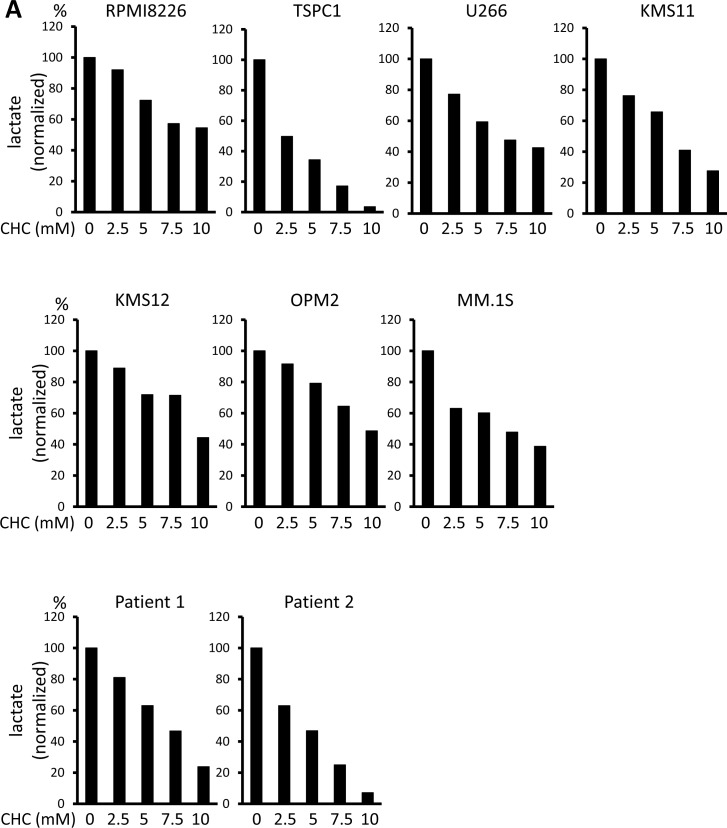
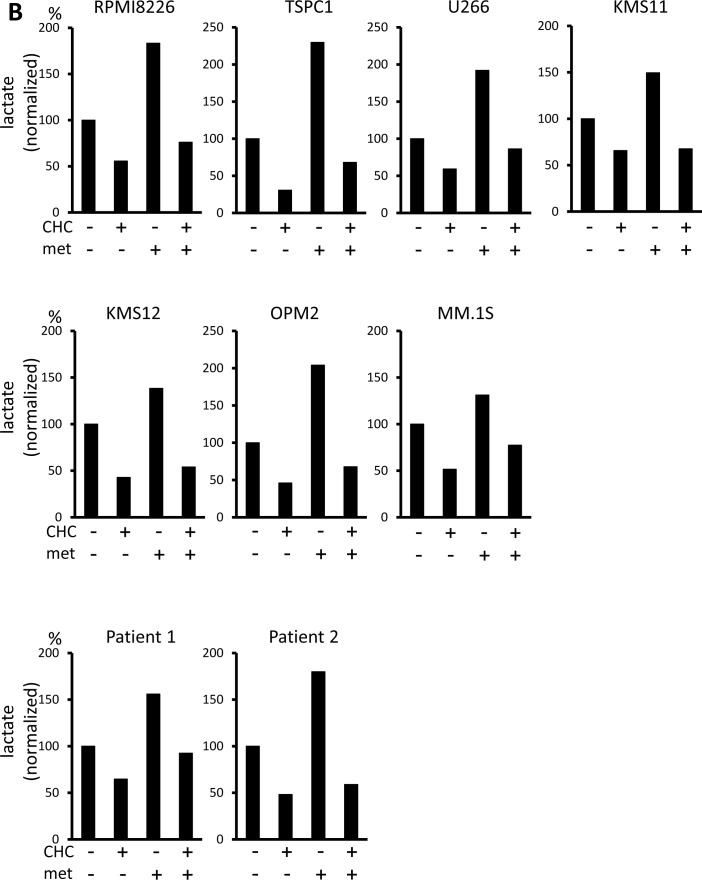
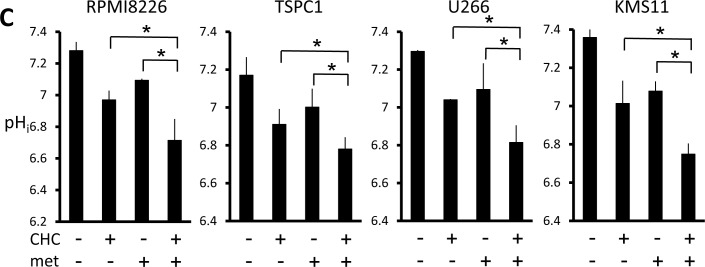
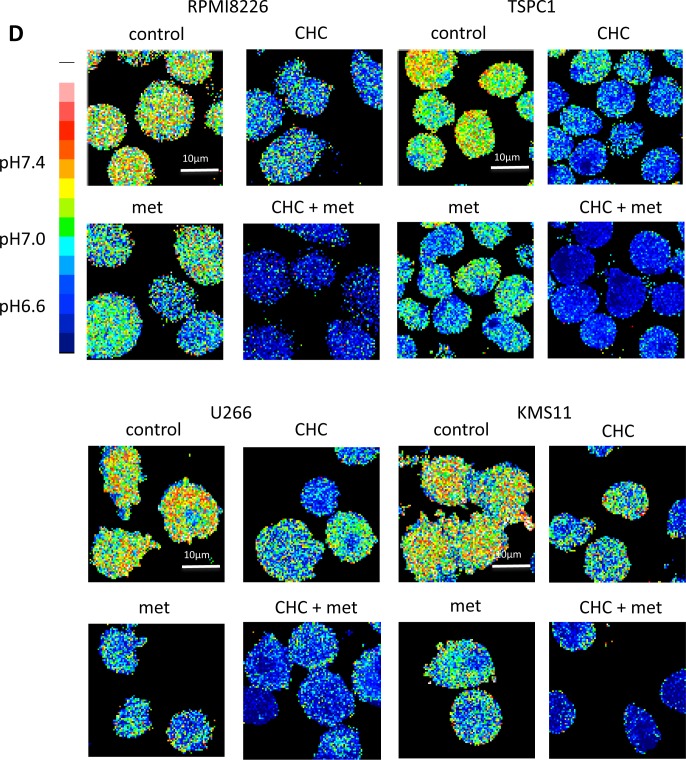
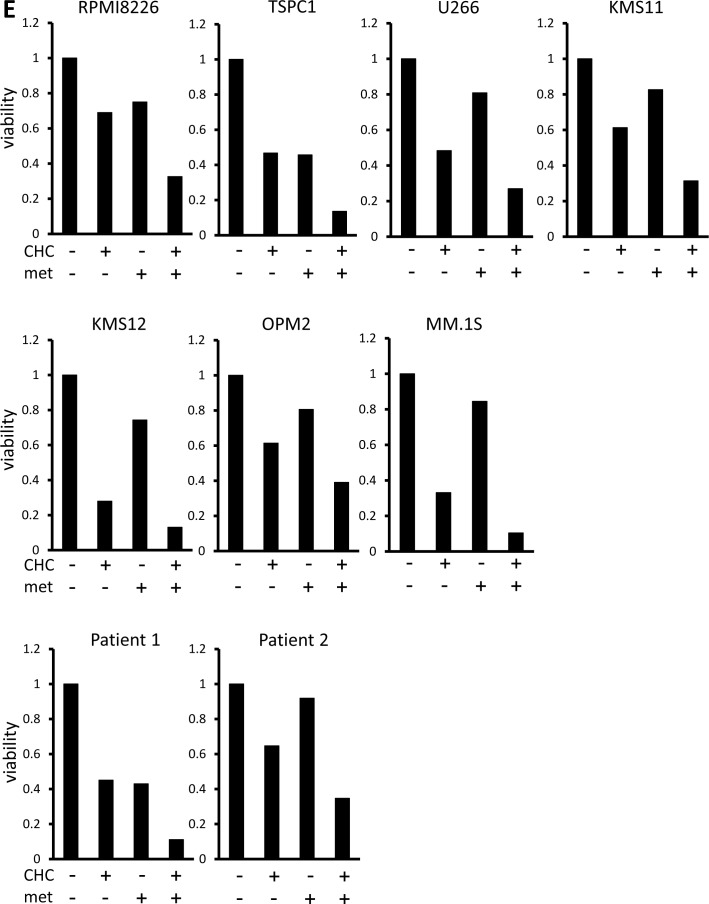
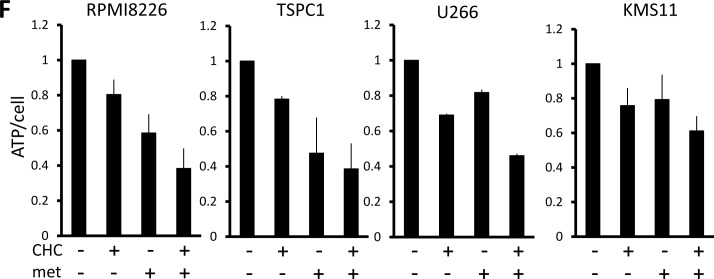
Figure 2. Additive effects of MCT blockade and metformin on intracellular pH and viability in MM cells.
A. MM cell lines and primary MM cells were cultured for three hours under indicated conditions; supernatants were assayed for lactate content. Results were shown as per cent change from baseline. B. MM cell lines and primary MM cells were cultured for three hours with 5 mM CHC and/or 10 mM metformin; supernatants were assayed for lactate content. Results were shown as per cent change from baseline. C. MM cells were cultured for three hours with 5 mM CHC and/or 10 mM metformin, then stained with BCECF-AM and assessed by spectrophotometer. Ratios of fluorescence intensities were used to calculate intracellular pH (pHi) as outlined in Methods. Results from three independent experiments were shown as the mean +/− SD. *p value < 0.05. D. Cells were treated the same as in C. and then photographed using a fluorescence microscope to produce emission ratio images. E. MM cell lines and primary MM cells were cultured for 24 hours with 5 mM CHC and/or 10 mM metformin, then subjected to a WST8 viability assay. Ratios of viable cells from the baseline were shown. E. MM cells were cultured for 2 hours with 5 mM CHC and/or 10 mM metformin and assayed for ATP content. Results from three independent experiments were expressed as ratios of change from the baseline with the mean +/− SD.

