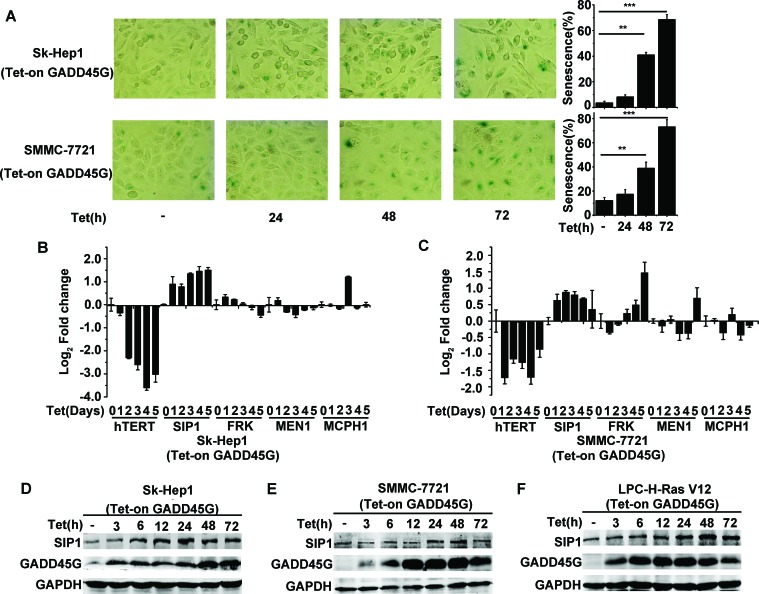
Figure 1. SIP1 activation in GADD45G-induced tumor cell senescence.
(A) Tet-on-GADD45G-Sk-Hep1 and Tet-on-GADD45G-SMMC-7721 cells were cultured for the indicated times in the presence of 2.5μg/mL DOX (Tet-on) for GADD45G induction. The representative images of SA-β-gal staining (left panel) and the percentage of SA-β-gal positive cells (right panel) are shown. Data shown are mean ± SD from three independent experiments (**P < 0.01, ***P < 0.001). SD, standard deviation. (B-C) Tet-on-GADD45G-Sk-Hep1 (B) and Tet-on-GADD45G-SMMC-7721 (C) cells were cultured with DOX for the indicated times. Cell lysates were harvested for analysis of indicated genes by qRT-PCR. (D-E) Tet-on-GADD45G-Sk-Hep1 (D) and Tet-on-GADD45G-SMMC-7721 cells (E) were cultured with DOX for the indicated times. Cell lysates were analyzed for SIP1 expression by Western blot. (F) Tet-on-GADD45G-H-Ras V12-transformed mouse liver progenitor cells (Tet-on-GADD45G-LPC-H-Ras V12) were cultured with DOX for the indicated times. SIP1 levels were analyzed by Western blot.

