
Figure 5. Comparative quantitative analysis of mTOR/HIF-1 pathway components as well as VEGF/TNF-α secretion in primary human AML cells and healthy human PLs.
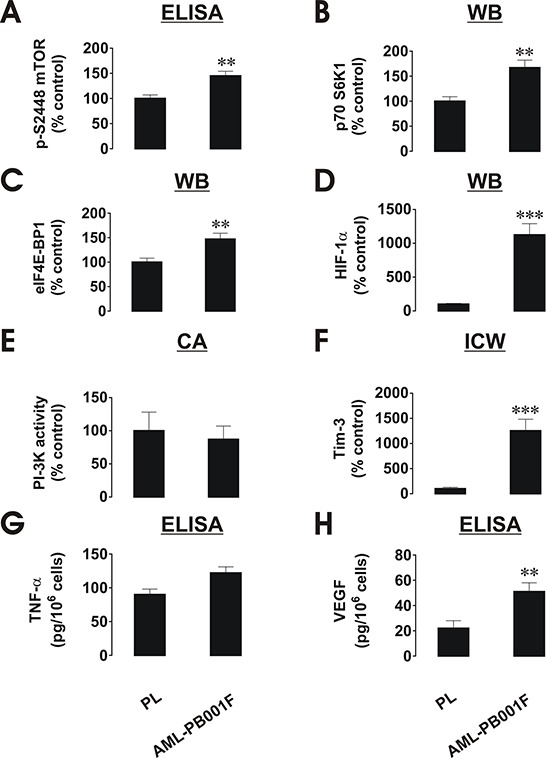
Protein levels were compared based on the indicated type of detection. A. pS2448 mTOR intracellular levels were detected by ELISA, normalised against total cellular protein and compared (results were statistically validated). B, C. and D. – Levels of p70 S6K1, eIF4E-BP1 and HIF-1α protein were detected by Western blot (WB), quantitated and normalised against respective actin values before comparison and statistical validation of the results. E. PI-3K activity levels were measured by colorimetric assay (CA), F. – Intracellular levels of Tim-3 were detected by in-cell Westerns (ICW). Fluorescence values obtained for healthy PLs and AML cells and were divided by respective cell number (1,500,000 or 300,000, see Figure 1) and used for comparison (the value in PLs was considered as 100%). Similar results were obtained when comparing Tim-3 values in AML cells and healthy PLs obtained by Western blot and normalised against actin G. TNF-α and H. VEGF levels were measured in the medium by ELISA and the amounts per 106 cells were compared and statistically validated. Data was obtained from 3–6 individual experiments, which gave similar results. Quantitative data are shown as means ± SEM; *p < 0.05; **p < 0.01; ***p < 0.01 vs. control.