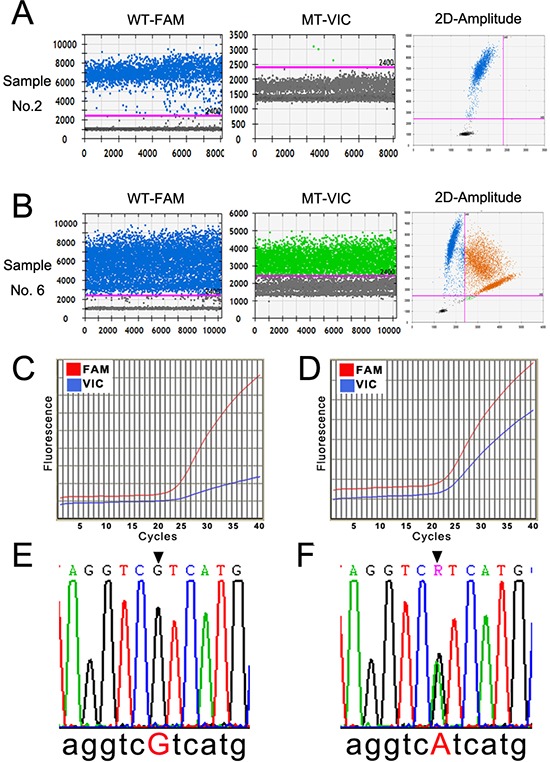
Figure 1. Detection profiles of the IDH1(R132H) mutation by ddPCR, qRT-PCR, and Sanger sequencing.

A and B. The representative 1-D and 2-D plots of the ddPCR amplification profile of a IDH1 wild-type and a IDH1(R132H) mutant sample. The pink line in the left two rows indicates the threshold, and the orange dots in the upper-right quadrant of the right row indicate the mutant signal. C and D. The amplification curve of qRT-PCR of a IDH1 wild-type and a IDH1(R132H) mutant sample. The red line denotes the wild-type (WT-FAM) sample, and the blue line denotes the mutant (MT-VIC). E and F. The results of Sanger sequencing of the wild-type and IDH1(R132H) mutant samples (CGT > CAT).
