
Figure 1. mRNA expression detected by quantitative real-time PCR.
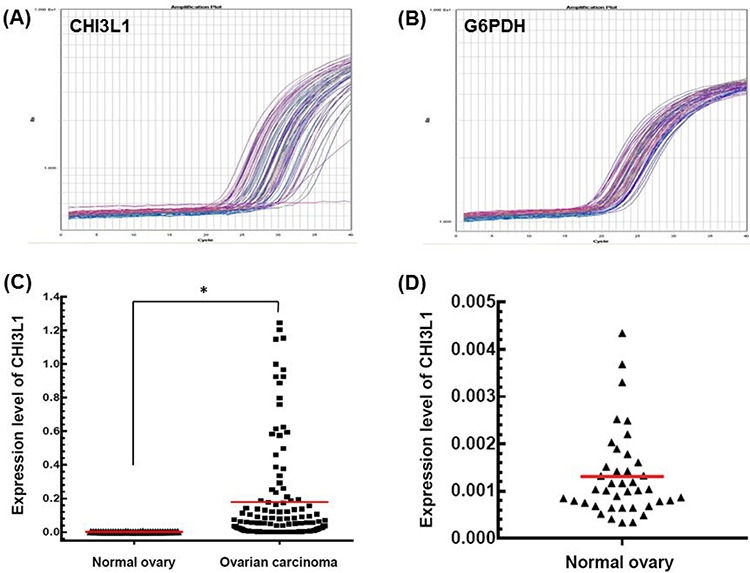
A. Representative figure of the quantification of CHI3L1 mRNA expression in tumor tissues. B. Representative figure of quantification of G6PDH mRNA expression in tumor tissues. C. CHI3L1 mRNA expression levels between normal and cancerous ovarian tissues. Black triangles indicated the normal ovarian tissues, and black squares indicated the ovarian cancer tissues.(*p < 0.05 by the Student's t-test) D. CHI3L1 mRNA expression levels of normal ovarian tissues were shown in detail.